欢迎来到相识电子书!
标签:统计
-
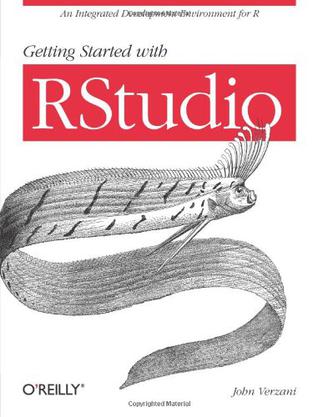
Getting Started with RStudio
This e-book will introduce users to the RStudio framework for using and programming R, the widely used open source statistical computing environment. The RStudio framework, is an open source project that brings together many powerful coding tools into an intuitive interface. It runs under all major platforms (Windows, Mac, Linux) and through a web browser (using the server installation). This text should appeal to newer R users and students who want to explore the interface to get the most out of R and to older R users who want to use a more modern looking development environment. The book will serve as both a resource to look up specific features provided by RStudio and as an introduction to the following processes with R: data analysis, programming and report generation. -
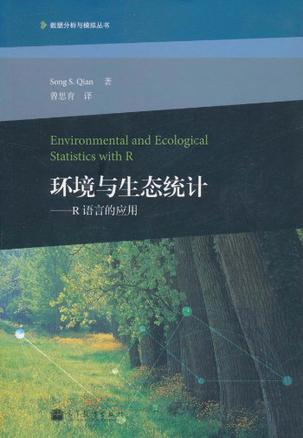
环境与生态统计
《环境与生态统计:R语言的应用》内容简介:在强调统计思维的归纳性本质基础上,《环境与生态统计:R语言的应用》把应用统计学跟环境与生态领域关联到一起。《环境与生态统计:R语言的应用》遵循解决统计建模问题的一般方法。内容覆盖了模型界定、参数估值和模型评估。作者用了很多实例来阐述统计学模型以及如何用R语言来实现模型。《环境与生态统计:R语言的应用》首先为开展简单的数据分析任务提供了基础知识。例如探索性数据分析和线性回归模型拟合。接下来重点介绍了统计建模,包括线性和非线性模型、分类和回归树以及广义线性模型。书中还讨论了用于模型检验的模拟,为开发出的模型提供评估工具,同时探讨了多层回归模型这类会对环境和生态学数据分析产生广泛影响的模型。 《环境与生态统计:R语言的应用》重点针对的是环境和生态学问题的统计建模和数据分析。通过引导读者理解解决科学问题和开发统计模型的过程,轻松地从科学假设过渡到统计模型。 -
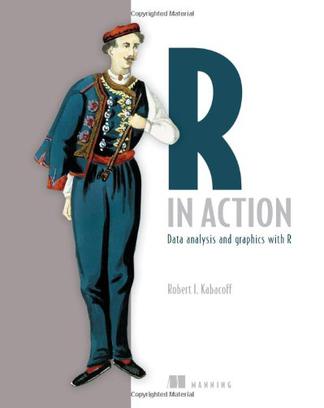
R in Action
The ability to interpret and act on the massive amounts of information locked in web and enterprise systems is critical to success in the modern business economy. R, a free software environment for statistical computing and graphics, is a comprehensive package that empowers developers and analysts to capture, process, and respond intelligently to statistical information. R in Action is the first book to present both the R system and the use cases that make it such a compelling package for business developers. The book begins by introducing the R language, and then moves on to various examples illustrating R's features. Coverage includes data mining methodologies, approaches to messy data, R's extensive graphical environment, useful add-on modules, and how to interface R with other software platforms and data management systems. -
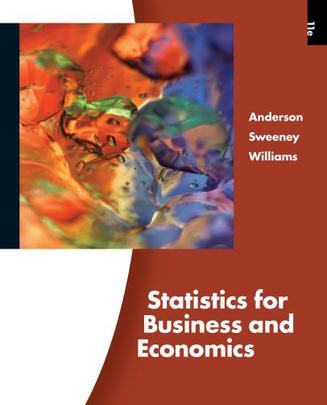
Statistics for Business and Economics
Discover how the most trusted approach to statistics today is Simply Powerful with the latest market-leading text from respected authors Anderson/Sweeney/Williams. STATISTICS FOR BUSINESS AND ECONOMICS, 11e introduces sound statistical methodology within a strong applications setting. The authors clearly demonstrate how statistical results provide insights into business decisions and present solutions to contemporary business problems. New cases and more than 350 real business examples and memorable exercises, 150 of which are new in this edition, present the latest statistical data and business information. With this book's comprehensive coverage and unwavering accuracy, you select the topics best for your course, including thorough coverage of the latest versions of MiniTab 15 and Excel 2007, along with StatTools and other leading Excel 2007 statistical add-ins within chapter appendices. Author-written support materials and CengageNOW online course management system provides time-saving, complete support to ensure student understanding. Choose Anderson/Sweeney/Williams' STATISTICS FOR BUSINESS AND ECONOMICS, 11e for the Simply Powerful statistical solution you need for your course. -
Statistical Analysis with R
This is a practical, step by step guide that will help you to quickly become proficient in the data analysis using R. The book is packed with clear examples, screenshots, and code to carry on your data analysis without any hurdle. If you are a data analyst, business or information technology professional, student, educator, researcher, or anyone else who wants to learn to analyze the data effectively then this book is for you. No prior experience with R is necessary. Knowledge of other programming languages, software packages, or statistics may be helpful, but is not required. -
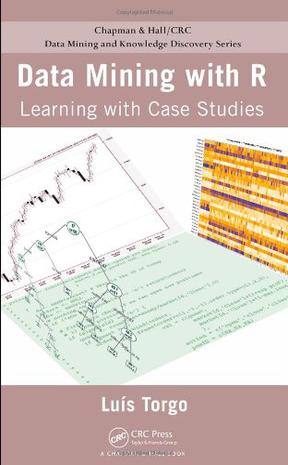
Data Mining with R
The versatile capabilities and large set of add-on packages make R an excellent alternative to many existing and often expensive data mining tools. Exploring this area from the perspective of a practitioner, Data Mining with R: Learning with Case Studies uses practical examples to illustrate the power of R and data mining. Assuming no prior knowledge of R or data mining/statistical techniques, the book covers a diverse set of problems that pose different challenges in terms of size, type of data, goals of analysis, and analytical tools. To present the main data mining processes and techniques, the author takes a hands-on approach that utilizes a series of detailed, real-world case studies: Predicting algae blooms Predicting stock market returns Detecting fraudulent transactions Classifying microarray samples With these case studies, the author supplies all necessary steps, code, and data. Web Resource A supporting website mirrors the do-it-yourself approach of the text. It offers a collection of freely available R source files that encompass all the code used in the case studies. The site also provides the data sets from the case studies as well as an R package of several functions. -
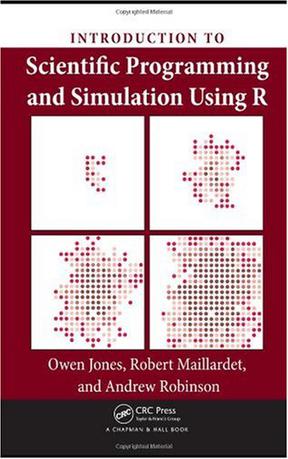
Introduction to Scientific Programming and Simulation Using R
Known for its versatility, the free programming language R is widely used for statistical computing and graphics, but is also a fully functional programming language well suited to scientific programming. An Introduction to Scientific Programming and Simulation Using R teaches the skills needed to perform scientific programming while also introducing stochastic modelling. Stochastic modelling in particular, and mathematical modelling in general, are intimately linked to scientific programming because the numerical techniques of scientific programming enable the practical application of mathematical models to real-world problems. Following a natural progression that assumes no prior knowledge of programming or probability, the book is organised into four main sections: * Programming In R starts with how to obtain and install R (for Windows, MacOS, and Unix platforms), then tackles basic calculations and program flow, before progressing to function based programming, data structures, graphics, and object-oriented code * A Primer on Numerical Mathematics introduces concepts of numerical accuracy and program efficiency in the context of root-finding, integration, and optimization * A Self-contained Introduction to Probability Theory takes readers as far as the Weak Law of Large Numbers and the Central Limit Theorem, equipping them for point and interval estimation * Simulation teaches how to generate univariate random variables, do Monte-Carlo integration, and variance reduction techniques In the last section, stochastic modelling is introduced using extensive case studies on epidemics, inventory management, and plant dispersal. A tried and tested pedagogic approach is employed throughout, with numerous examples, exercises, and a suite of practice projects. Unlike most guides to R, this volume is not about the application of statistical techniques, but rather shows how to turn algorithms into code. It is for those who want to make tools, not just use them. -
Introductory Time Series with R
Yearly global mean temperature and ocean levels, daily share prices, and the signals transmitted back to Earth by the Voyager space craft are all examples of sequential observations over time known as time series. This book gives you a step-by-step introduction to analysing time series using the open source software R. Each time series model is motivated with practical applications, and is defined in mathematical notation. Once the model has been introduced it is used to generate synthetic data, using R code, and these generated data are then used to estimate its parameters. This sequence enhances understanding of both the time series model and the R function used to fit the model to data. Finally, the model is used to analyse observed data taken from a practical application. By using R, the whole procedure can be reproduced by the reader. All the data sets used in the book are available on the website http://www.massey.ac.nz/~pscowper/ts. The book is written for undergraduate students of mathematics, economics, business and finance, geography, engineering and related disciplines, and postgraduate students who may need to analyse time series as part of their taught programme or their research. Paul Cowpertwait is a senior lecturer in statistics at Massey University with a substantial research record in both the theory and applications of time series and stochastic models. Andrew Metcalfe is an associate professor in the School of Mathematical Sciences at the University of Adelaide, and an author of six statistics text books and numerous research papers. Both authors have extensive experience of teaching time series to students at all levels. -
当我们变成一堆数字
《当我们变成一堆数字》讲述了:每一天,我们的身后都拖着一条由个人信息组成的长长的“尾巴”,这只是因为我们生活在一个现代化的世界。我们——点击网页、 切换电视频道、驾车穿过自动收费站、 用信用卡购物、使用手机, 而雅虎、Google这样的公司,正在以平均每人、每月2500条信息的速度,捕获我们的详细数据。是谁在关注这些数据?他们打算用这些数据来干吗?这正是美国《新闻周刊》资深记者斯蒂芬·贝克在这本极具魅惑力的书里所探究的问题,而他的回答既让人惊讶,又令人不安。一群新兴的数学精英,正千方百计地以惊人的准确性,剖析我们的每个举动,预测我们的行动计划。他们神不知鬼不觉地,将我们买了什么、对什么感兴趣、与谁坠入爱河的人间风光尽收眼底,就是为了巧妙地操控我们的行为。在这本汇聚数字报告和分析的力作里,斯蒂芬·贝克展示了一个我们正在进入的鲜活的世界,告诉我们谁在支配人类。数字科学家渗透了人世间的每个领域,将我们描绘为工薪族、购物者、选民、博主、潜藏的恐怖分子、病患者,甚至是恋人。他们在公司洞察我们的电子邮件和电话记录,来推测有多少员工真正在为公司的盈利添砖加瓦。他们分析我们的购买行为,以搞清我们是在节衣缩食、瘦身,还是有新的理财计划。从IBM、Google、保险公司到奥巴马竞选团队,莫不重金礼聘身怀绝技的“数字搜客”,从一大堆数字符码中过滤出宝贵的趋势和观点……。 -
重构大数据统计
基于《重构大数据统计》内容开发的数据分析工具已经在阿里巴巴集团内部的多个部门使用,并取得显著效果。 大数据的统计计算是进行数据探索和分析挖掘的基础,在实际应用中会遇到两个问题:一个是需要使用多少资源;另一个是计算时间,它关系到数据探索分析的效率和效果。 人们都希望花更少的钱,并且希望计算时间更短,但对于某个确定的计算过程,它们是成反比的。《重构大数据统计》就是从统计计算的算法入手,重构其计算过程,从而同时降低资源使用量和计算时间。 《重构大数据统计》提出了一套完整的关于大数据统计的计算理论,包括常用的各种统计量和统计方法。 《重构大数据统计》提供大量的示例程序代码帮助读者进一步了解算法细节,便于将书中的方法运用于实际计算。 《重构大数据统计》适合对大数据分析感兴趣的读者阅读:前面章节比较容易理解,包含了常用统计量的计算;后面的各章节需要读者具备一些基础知识。建议读者根据自己的兴趣和工作需要,选择相应的内容参考。 -
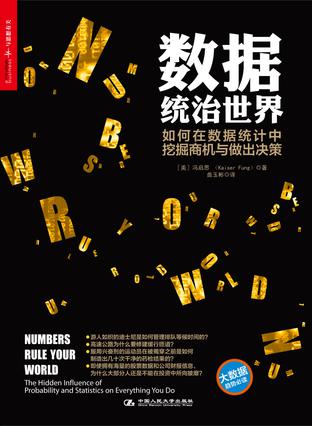
数据统治世界
《大数据时代》之后的必读之作。《大数据时代》改变了我们的思维,《数据统治世界》将改变我们利用数据的方式。揭示5大统计式思维,让你可以解决在商业、金融、科学、公共卫生以及犯罪调查中遇到的难题! 他用难以胜数的来自真实世界的例子,为我们展现了统计学在日 常生活中的实际应用,以一种简单、务实、无限娱乐性的方式为您解释了数据所具有的神秘力量。 游人如织的迪士尼是如何管理排队等候时间的?高速公路为什么要修建缓行匝道?服用兴奋剂的运动员在被揭穿之前是如何制造出几十次干净的药检结果的?即使拥有海量的股票数据和公司财报信息,为什么大部分人还是不能在投资中所向披靡?为何不同的人有不同的保险费率,信用评分又是如何运作的?当传染病暴发的时候,科学家是如何帮我们找到感染源头,保证我们的安全的?统计学家为何不怕飞机失事,但也不相信能够中奖的彩票?十个精彩纷呈的故事,带你领略数据的别样魅力。 [编辑推荐] 《大数据时代》之后的必读之作,看数据如何影响你的工作与生活,教你如何从数据统计中挖掘商机与做出决策。 全书用10个精彩故事,通过精心的叙述,翔实的资料,别样的角度,为我们开启一趟惊心动魄之旅,展现统计学家是如何利用统计式思维解决我们身边的问题,数据又是如何影响我们的生活。 本书作者系纽约大学统计学教授,视频分享网站Vimeo商业智能分析副总裁,并且著有超高人气的博客“垃圾图表”,内容及可读性极佳。 湛庐文化出品。 [推荐语] 约翰•萨尔 美国赛仕软件研究所执行副总裁、著名统计学家 书中所描述的事件都是新闻记者关注的热点问题,事件内幕经由数据阐释出来令人醍醐灌顶,同时数据也揭示了世界的动态性,这正是本书的魅力所在。 伊恩•艾尔斯 耶鲁大学教授 自组织数据挖掘技术正在冲击着我们的世界,有些人对此感到惴惴不安。冯启思的这本书开启了一扇窗,让我们看到预测分析的利与弊。 -
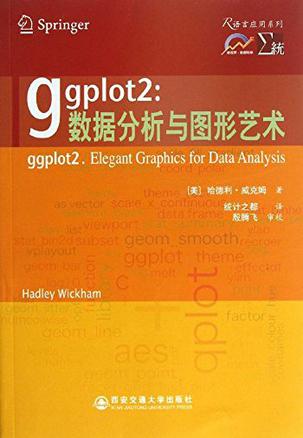
ggplot2:数据分析与图形艺术
中译本序 每当我们看到一个新的软件,第一反应会是:为什么又要发明一个新软件?ggplot2是R世界里相对还比较年轻的一个包,在它之前,官方R已经有自己的基础图形系统(graphics包)和网格图形系统(grid包),并且Deepayan Sarkar也开发了lattice包,看起来R的世界对图形的支持已经足够强大了。那么我们不禁要问,为什么还要发明一套新的系统? 设计理念 打个比方,想想我们小时候怎样学中文的。最开始的时候我们要识字,不认识字就没法阅读和写作,但我们并不是一直按照一个个汉字学习的,而是通过句子和具体的场景故事学习的。为什么不在小学时背六年字典呢?那样可能认识所有的汉字。原因很简单,光有单字,我们不会说话,也无法阅读和写作。缺的是什么?答案是对文字的组织能力,或者说语法。 R的基础图形系统基本上是一个“纸笔模型”,即:一块画布摆在面前,你可以在这里画几个点,在那里画几条线,指哪儿画哪儿。后来lattice包的出现稍微改善了这种情况,你可以说,我要画散点图或直方图,并且按照某个分类变量给图中的元素上色,此时数据才在画图中扮演了一定的中心角色,我们不用去想具体这个点要用什么颜色(颜色会根据变量自动生成)。然而,lattice继承了R语言的一个糟糕特征,就是参数设置铺天盖地,足以让人窒息,光是一份xyplot()函数的帮助文档,恐怕就够我们消磨一天时间了,更重要的是,lattice仍然面向特定的统计图形,像基础图形系统一样,有直方图、箱线图、条形图等等,它没有一套可以让数据分析者说话的语法。 那么数据分析者是怎样说话的呢?他们从来不会说这条线用#FE09BE颜色,那个点用三角形状,他们只会说,把图中的线用数据中的职业类型变量上色,或图中点的形状对应性别变量。有时候他们画了一幅散点图,但马上他们发现这幅图太拥挤,最好是能具体看一下里面不同收入阶层的特征,所以他们会说,把这幅图拆成七幅小图,每幅图对应一个收入阶层。然后发现散点图的趋势不明显,最好加上回归直线,看看回归模型反映的趋势是什么,或者发现图中离群点太多,最好做一下对数变换,减少大数值对图形的主导性。 从始至终,数据分析者都在数据层面上思考问题,而不是拿着水彩笔和调色板在那里一笔一划作图,而计算机程序员则倾向于画点画线。Leland Wilkinson的著作在理论上改善了这种状况,他提出了一套图形语法,让我们在考虑如何构建一幅图形的时候不再陷在具体的图形元素里面,而是把图形拆分为一些互相独立并且可以自由组合的成分。这套语法提出来之后他自己也做了一套软件,但显然这套软件没有被广泛采用;幸运的是,Hadley Wickham在R语言中把这套想法巧妙地实现了。 为了说明这种语法的想法,我们考虑图形中的一个成分:坐标系。常见的坐标系有两种:笛卡尔坐标系和极坐标系。在语法中,它们属于一个成分,可自由拆卸替换。笛卡尔坐标系下的条形图实际上可以对应极坐标系下的饼图,因为条形图的高可以对应饼图的角度,本质上没什么区别。因此在ggplot2中,从一幅条形图过渡到饼图,只需要加极少量的代码,把坐标系换一下就可以了。如果我们用纸笔模型,则可以想象,这完全是不同的两幅图,一幅图里面要画的是矩形,另一幅图要画扇形。 更多的细节在本书中会介绍,这里我们只是简略说明用语法画图对用纸笔画图来说在思维上的优越性;前者是说话,后者是说字。 发展历程 ggplot2是Hadley在爱荷华州立大学博士期间的作品,也是他博士论文的主题之一,实际上ggplot2还有个前身ggplot,但后来废弃了,某种程度上这也是Hadley写软件的特征,熟悉他的人就知道这不是他第一个“2”版本的包了(还有reshape2)。带2的包和原来的包在语法上会有很大的改动,基本上不兼容。尽管如此,他的R代码风格在R社区可谓独树一帜,尤其是他的代码结构很好,可读性很高,ggplot2是R代码抽象的一个杰作。读者若感兴趣,可以在GitHub网站上浏览他的包:https://github.com/hadley。在用法方面,ggplot2也开创了一种奇特而绝妙的语法,那就是加号:一幅图形从背后的设计来说,是若干图形语法的叠加,从外在的代码来看,也是若干R对象的相加。这一点精妙尽管只是ggplot2系统的很小一部分,但我个人认为没有任何程序语言可比拟,它对作为泛型函数的加号的扩展只能用两个字形容:绝了。 至2013年2月26日,ggplot2的邮件列表(http://groups.google.com/group/ggplot2 )订阅成员已达3394人,邮件总数为15185封,已经成为一个丰富、活跃的用户社区。未来ggplot2的发展也将越来越依赖于用户的贡献,这也是很多开源软件最终的走向。 关于版本更新 原书面世之时,ggplot2的版本号是0.8.3,译者开始翻译此书时是0.9.0版本;该版本较之0.8.3,内部做了一些大改动。此后,ggplot2频繁升级,目前版本号是0.9.3,当然这也给本书的翻译过程带来了相当大的麻烦。因为译者不但要修正原书中大量过时的代码、重新画图,还要修正过时的理念,以及处理数次版本更新的影响。所幸,在翻译过程中,译者得到了本书审校殷腾飞博士、ggplot2开发者Hadley Wickham和Wistong Chang的大力帮助。 如果你是老用户,那么可能需要阅读下面的小节。之后ggplot2有过多次更新,尤其是0.9.0之后,ggplot2的绘图速度和帮助文档有了质的飞跃。关于0.9的更新,读者可以从https://github.com/downloads/hadley/ggplot2/guide-col.pdf下载一份细致的说明文档,但原文档比较长,而且有些内部更新问题我们也不一定需要了解,因此这里给一段概述。 ggplot2的帮助文档大大扩充了,过去头疼的问题之一就是一个函数里面不知道有哪些可能的参数,例如theme()函数,现在已经有了详细说明。 新增图例向导函数guide_legend()和guide_colorbar(),前者可以用来指导图例的排版,例如可以安排图例中元素排为n行m列;后者增强了连续变量图例的展示,例如当我们把颜色映射到一个连续变量上时,过去生成的图例是离散的,现在可以用这个函数生成连续颜色的图例(渐变色)。 新增几何对象函数geom_map()(让地图语法变得更简单),geom_raster()(更高效的geom_tile()),geom_dotplot()(一维点图,展示变量密度分布)和geom_violin()(小提琴,实为密度曲线)。 新增统计变换函数stat_summary2d()(在二维网格上计算数据密度),stat_summary_hex()(在六边形“蜂巢”上计算数据密度),stat_bindot()(一维点图密度),stat_ydensity()(密度曲线,用于小提琴图)。 facet_grid()支持X轴和Y轴其中一者可以有自由的刻度(根据数据范围而定),以往要么所有切片使用同样的坐标轴刻度,要么所有都自由。 geom_boxplot()开始支持画箱线图的凹槽(notch),就像R基础图形系统中的boxplot()函数。 新增函数ggmissing()用来展示缺失值的分布,ggorder()按照数据观察顺序先后画折线图,ggstructure()展示数据热图。 另外这次更新涉及到一些函数参数名称的变化,如果旧代码在这个版本中报错说有未使用的参数,那么用户需要再次查看帮助文档,确保输入的参数在函数中存在。在所有这些表面的更新背后,实际上ggplot2很大程度上被重写了,例如开始使用R自带的S3泛型函数设计,以及将过去ggplot2的功能继续模块化为一些独立的包,一个典型的例子就是标度部分的功能被抽象到scales包中,从数据映射到颜色、大小等外观属性可以由这个包直接完成。这种分拆也使得其他开发者可使用过去ggplot2内部的一些功能函数。 0.9.1版本主要解决了0.9.0版本中的一些漏洞。ggplot2在2012年9月4日发布了新的版本0.9.2,其中一些特性和更新有必要提及: 采用了全新的主题(theme)系统,opts()函数已被标记为“不推荐使用”(deprecated),将在未来版本中被取消,取而代之的是theme()函数,主题元素(theme element)由属性列表构成,支持继承,主题之间可以直接进行合并等操作。详情参见wiki页面:https://github.com/wch/ggplot2/wiki/New-theme-system 。 依赖于新的gtable包。 用来更方便地调整修改ggplot2图形中的图元,ggplotGrob()会返回一个gtable类,这个对象可以利用gtable包中提供的函数和接口进行操作。 所有“模板”类型的图形函数,比如plotmatrix(),ggorder()等等,已被标记为“不推荐使用”(deprecated),将在未来版本中取消。 在本书出版之际,ggplot2更新到了版本0.9.3,修复了0.9.2的一些漏洞,其主要更新包括 不再支持plotmatrix()函数。 geom_polygon()提速,比如世界地图的绘制快了12倍左右。 新增部分主题,比如theme_minimal(),theme_classic()。 本书的所有代码和图片都是针对新版本0.9.3的,在内容方面也根据版本更新对原文做了适当的增删填补,以满足读者的需求。 本书把影响正文阅读的彩图集中放在附录后面,读者可以随时翻阅。 致谢 在听说我们翻译完这本书之后,本书原著Hadley很高兴,给我们发邮件说: I am excited and honoured to have my book translated to Chinese. ggplot2 has become far more popular than I ever imagined, and I'm excited that this translation will allow many more people to learn ggplot2. I'm very grateful that Yihui and his team of translators (Nan Xiao, Tao Gao, Yixuan Qiu, Weicheng Zhu, Taiyun Wei and Lanfeng Pan) made this possible. One of the biggest improvements to ggplot2 since the book was first written is the ggplot2 mailing list. This is a very friendly environment where you can get help with your visualisations, and improve your own knowledge of ggplot2 by helping others solve their problems. I'd strongly encourage you to join the mailing list, even if you think your English is not very good -- we are very friendly people. 我们感谢这本书的译者,包括邱怡轩(第1~2章)、主伟呈(第3~4章)、肖楠(第5~6章)、高涛(第7~8章)、潘岚锋(第9章)、魏太云(第10章、附录以及翻译过程的协调安排和全书的LaTeX排版工作)。所有译者均来自于统计之都(http://cos.name )。 爱荷华州立大学的殷腾飞博士、中国人民大学统计学院的孟生旺教授、浙江大学的张政同学通读了译稿,提出了很多有用的建议,殷腾飞博士还提供了大多数新版本中的解决方案,并担任本书的审校。肖凯老师和余光创博士分别对第1~4章、第8~10章以及附录提出了很多修改意见,此外,中国人民大学的陈妍、李晓矛、谢漫锜三位同学、中国再保险公司的李皞先生、百度公司的韩帅先生、eBay公司的陈丽云女士、Mango Solutions公司的李舰先生、京东商城的刘思喆先生、首钢总公司的邓一硕先生、新华社的陈堰平先生在此书的翻译过程中也曾提过不少宝贵的建议,在此一并表示感谢。 为了更好地服务社区,我们还建立了翻译主页:https://github.com/cosname/ggplot2-translation ,读者可以在这里得到最新的勘误和书中的代码,也可以随时提出任何问题。 谢益辉 2013年2月26日 -
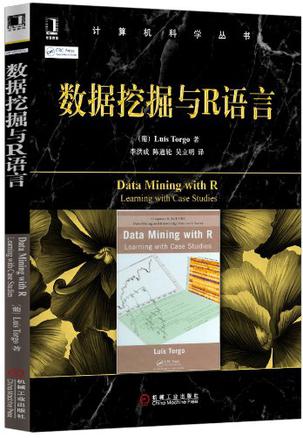
数据挖掘与R语言
“如果你想学习如何用一款统计专家和数据挖掘专家所开发的免费软件包,那就选这本书吧。本书包括大量实际案例,它们充分体现了R软件的广度和深度。” —— Bernhard Pfahringer, 新西兰怀卡托大学 本书利用大量给出必要步骤、代码和数据的具体案例,详细描述了数据挖掘的主要过程和技术,广泛涵盖数据大小、数据类型、分析目标、分析工具等方面的各种具有挑战性的问题。 本书的支持网站(http://www.liaad.up.pt/~ltorgo/DataMiningWithR/)给出了案例研究的所有代码、数据集以及R函数包。 本书特色 通过仔细选择的案例涵盖了主要的数据挖掘技术。 给出的代码和方法可以方便地复制或者改编后应用于自己的问题。 不要求读者具有R、数据挖掘或统计技术的基础知识。 包含R和MySQL基础知识的简介。 提供了对数据挖掘技术的特性、缺点和分析目标的基本理解。 -
IBM SPSS数据分析与挖掘实战案例精粹
《IBM SPSS数据分析与挖掘实战案例精粹》以IBM SPSS Statistics 20.0和IBM SPSS Modeler 14.1为工具,提供了医疗、金融、保险、汽车、快速消费品、市场研究、互联网等多个行业的数据分析/挖掘案例,基于实战需求,详细讲解整个案例的完整分析过程,并将模型和软件的介绍融于案例讲解之中,使读者在阅读时能突破方法和工具的局限,真正聚集于对数据分析精髓的领悟。《IBM SPSS数据分析与挖掘实战案例精粹》所附光盘包括案例数据和分析程序/流文件,读者可完整重现全部的分析内容。 -
商务统计
《商务统计(原书第6版)》从实用的角度介绍了统计思想的要素,详解了如何正确理解数据和图表、把握数据的内在规律、建立稳健可靠的统计模型、以及如何利用这些信息来做出商业决策。书中提供了大量讲解透彻的例题,辅以充足的章节练习——而这些数据绝大多数是从报章杂志和四位作者丰富的统计咨询实践中得到的真实案例、能帮助读者开拓统计应用的视野,领略到商业统计的魅力。 -
An Introduction to Mathematical Statistics and Its Applications
Noted for its integration of real-world data and case studies, this guide offers sound coverage of the theoretical aspects of mathematical statistics. It demonstrates how and when to use statistical methods, while reinforcing the calculus that readers have already mastered. Presents standard statistical techniques in a mathematical context, allowing the reader to see the underlying hypotheses for the applications. Uses case studies and practical worked-out examples to motivate statistical reasoning and demonstrate the application of statistical methods to a wide variety of real-world situations. Discusses practical problems in the application of the ideas covered in each chapter, as well as common misunderstandings or faulty approaches. Revised Minitab sections now conform to the Version 14, the latest release. For anyone interested in learning more about mathematical statistics. -
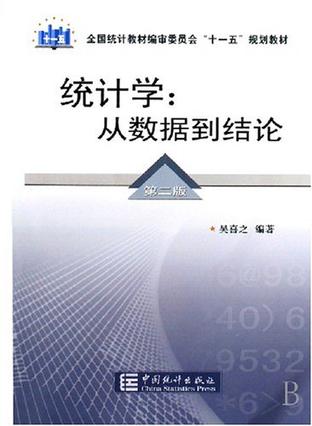
统计学(第二版)
统计学:从数据到结论,ISBN:9787503749964,作者: -
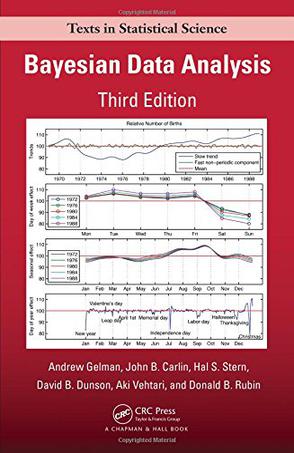
Bayesian Data Analysis, Third Edition
This third edition of a classic textbook presents a comprehensive introduction to Bayesian data analysis. Written for students and researchers alike, the text is written in an easily accessible manner with chapters that contain many exercises as well as detailed worked examples taken from various disciplines. This third edition provides two new chapters on Bayesian nonparametrics and covers computation systems BUGS and R. It also offers enhanced computing advice. The book's website includes solutions to the problems, data sets, software advice, and other ancillary material. -
Applied Linear Regression Models
Thoroughly updated and more straightforward than ever, Applied Linear Regression Models includes the latest statistics, developments, and methods in multicategory logistic regression; expanded treatment of diagnostics for logistic regression; a more powerful Levene test; and more. Cases, datasets, and examples allow for a more real-world perspective and explore relevant uses of regression techniques in business today.
热门标签
下载排行榜
- 1 梦的解析:最佳译本
- 2 李鸿章全传
- 3 淡定的智慧
- 4 心理操控术
- 5 哈佛口才课
- 6 俗世奇人
- 7 日瓦戈医生
- 8 笑死你的逻辑学
- 9 历史老师没教过的历史
- 10 1分钟和陌生人成为朋友

