欢迎来到相识电子书!
标签:数据分析
-
京东平台数据化运营
“赢在京东”系列电商教程是京东官方认证用书,由一线业务精英和权威专家团队出品的电商读物,将不断分享京东发展过程中的优势资源与先进经验,希望能满足品牌商家、创业者、电子商务从业人员等发展之所需。 《京东平台数据化运营》为继首部《京东平台运营攻略》之后的又一部力作。从商家最关心的流量、转化率、客单价、复购率、行业分析五个维度展开,详解为可执行可实操的方法和步骤,帮助商家如何运用数据化思维去分析店铺,指导店铺运营。 《京东平台数据化运营》首次公开了许多京东平台的独有特色,例如关于京东 APP端、微信端、手机QQ端等无线流量的详细介绍;关于优化京东搜索流量的方法和步骤;关于京东平台转化率相关指标的优化方法。同时,《京东平台数据化运营》还联合京东平台资深商家提供了多个实操案例。 -
Excel数据透视表应用大全
《Excel数据透视表应用大全》全面系统地介绍了Excel数据透视表的技术特点和应用方法,深入揭示数据透视表的原理,并配合大量典型实用的应用实例,帮助读者全面掌握Excel数据透视表技术。《Excel数据透视表应用大全》共18章,分别介绍创建数据透视表,改变数据透视表的布局,刷新数据透视表,数据透视表的格式设置,在数据透视表中排序,数据透视表的项目组合,在数据透视表中进行计算,数据透视表函数的综合应用,创建动态数据透视表,创建复合范围的数据透视表,通过导入外部数据“编辑0LEDB查询”创建数据透视表,使用“MicrosoftQuery”数据查询创建透视表,利用多样的数据源创建数据透视表,在Web上使用数据透视表,数据透视表与VBA,使用数据透视图,数据透视表与数据透视图打印技术,数据透视表技术综合运用等内容。 -
多变量分析
《多变量分析:统计软件与数据分析》是一本结合多变量分析统计理论、软件包与资料分析的研究方法论书籍。内容涵盖多变量变异系数分析、主成分分析、因素分析、区别分析、集群分析、典型相关、多向度多元尺度、线性结构模式、Logistic回归分析及对数线性模式等社会科学常见的多变量分析方法。作者运用SPSS与SAS两种普遍使用的软件包,完整地介绍其于各统计方法的应用外,并辅以实例进行数据分析与报表结果解释,理论与实用面向兼具。 初入门多变量分析方法者,可逐章阅读提升对多变量统计方法论的认识;而对于已熟悉方法论的读者,可根据研究问题,通过《多变量分析:统计软件与数据分析》的软件包操作与报表解释,解决研究上的需求。 -
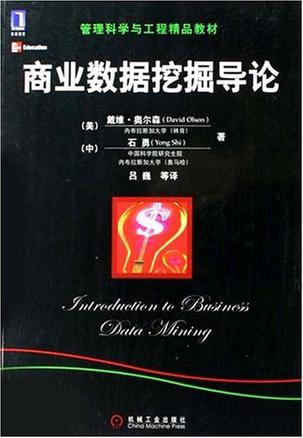
商业数据挖掘导论
本书综合商业专业知识和数据挖掘模型开发于一体,系统地介绍了数据挖掘商业环境、数据挖掘技术及其在商业中的应用。在注重对数据挖掘技术讲解的同时,强调了数据挖掘在商业决策领域中的应用,弥补了大多数数据仓库技术类书籍商业应用不足的缺点。本书主线清晰,案例丰富,语言精练。 本书既可以作为商业专业本科生、研究生的教材,也可以在MBA、EMBA 教学和企业培训中使用。 -
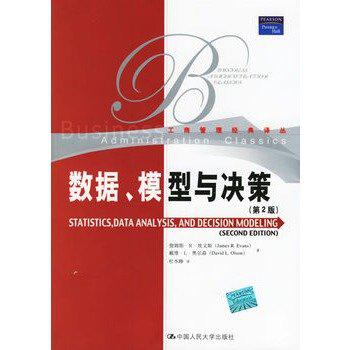
数据、模型与决策
数据、模型与决策(第2版),ISBN:9787300071435,作者:埃文斯,奥尔森 著,杜本峰 译 -
数据挖掘技术
本书是数据挖掘领域的经典著作,数年来畅销不衰。全书从技术和应用两个方面,全面、系统地介绍了数据挖掘的商业环境、数据挖掘技术及其在商业环境中的应用。自从1997年本书第1版出版以来,数据挖掘界发生了巨大的变化,其中的大部分核心算法仍然保持不变,但是算法嵌入的软件、应用算法的数据库以及用于解决的商业问题都有所演进。第2版展示如何利用基本的数据挖掘方法和技术,解决常见的商业问题。 本书涵盖核心的数据挖掘技术,包括:决策树、神经网络、协同过滤、关联规则、链接分析、聚类和生存分析等。此外,还提供了数据挖掘最佳实践、数据挖掘的最新进展和一些富有挑战性的研究课题,极具技术深度与广度。配套网站www.data-miners.com/companion提供了每章的练习和用于测试各种数据挖掘技术的数据。全书语句凝炼、清新,对复杂概念的实际应用进行了生动解释,是必不可少的数据挖掘教材。 -
深入浅出数据分析
《深入浅出数据分析》以类似“章回小说”的活泼形式,生动地向读者展现优秀的数据分析人员应知应会的技术:数据分析基本步骤、实验方法、最优化方法、假设检验方法、贝叶斯统计方法、主观概率法、启发法、直方图法、回归法、误差处理、相关数据库、数据整理技巧;正文之后,意犹未尽地以三篇附录介绍数据分析十大要务、R工具及ToolPak工具,在充分展现目标知识以外,为读者搭建了走向深入研究的桥梁。 本书构思跌宕起伏,行文妙趣横生,无论读者是职场老手,还是业界新人;无论是字斟句酌,还是信手翻阅,都能跟着文字在职场中走上几回,体味数据分析领域的乐趣与挑战。 -
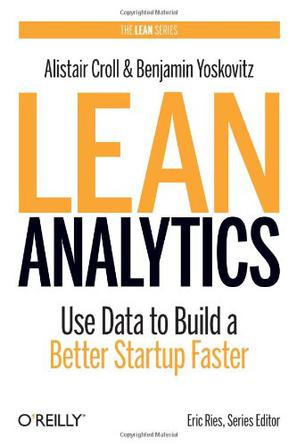
Lean Analytics
If you're involved with a startup, analytics help you find your way to the right product and market before the money runs out. But with a flood of information available, where do you start? This book shows you what to measure, how to analyze it, and how to report it, whether you're evaluating your business model, testing new features, enticing investors, or reporting progress to advisers. Written by Alistair Croll (founder of Coradiant) and Ben Yoskovitz (co-founder of Year One Labs), Lean Analytics lays out practical, proven steps to take your startup from initial idea to product/market fit and beyond. Examples and case studies show entrepreneurs and intrapreneneurs (entrepreneurs inside larger organizations) how to identify and measure a startup's single most important metric, and how to iterate until you get it right. While the authors primarily cover technology startups, their lessons can be applied far beyond the Web. Even traditional businesses are embracing a lean, learn-first approach, as demonstrated by owners of a San Francisco deli that used a temporary "pop-up" method to optimize their menu and operations before launching a permanent restaurant. -
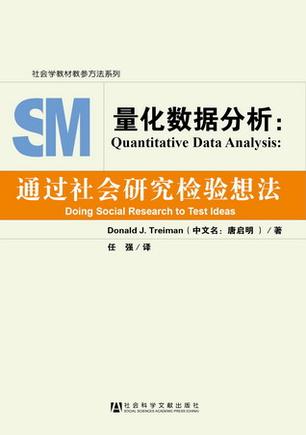
量化数据分析
这是一本由学术界公认的大师和睿智的教师介绍现代社会科学研究方法的一流教材。Treiman使复杂的问题变得简单,并提供了许多实用的建议和最优的方法。本书没有复杂的数学推导,通过大量的实例领会社会科学研究的基本逻辑和设计思想,图文并茂,浅显易懂,把握前沿最新社会科学成果。《量化数据分析:通过社会研究检验想法》不只是讲授统计学——它讲授如何用统计学回答社会问题,它教会学生如何运用统计学开展一流的量化研究。 -
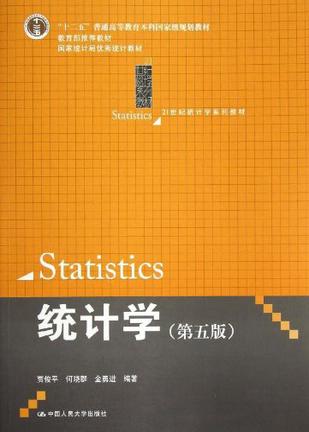
统计学
统计学(第5版),ISBN:9787300153841,作者:贾俊平 等 著 -
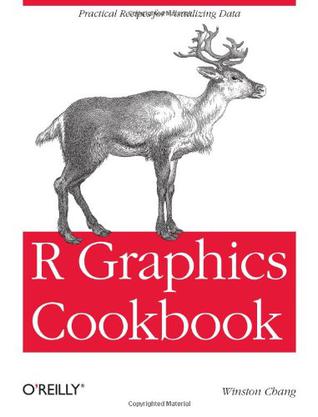
R Graphics Cookbook
This practical guide provides more than 150 recipes to help you generate high-quality graphs quickly, without having to comb through all the details of R's graphing systems. Each recipe tackles a specific problem with a solution you can apply to your own project, and includes a discussion of how and why the recipe works. Most of the recipes use the ggplot2 package, a powerful and flexible way to make graphs in R. If you have a basic understanding of the R language, you're ready to get started. Use R's default graphics for quick exploration of data Create a variety of bar graphs, line graphs, and scatter plots Summarize data distributions with histograms, density curves, box plots, and other examples Provide annotations to help viewers interpret data Control the overall appearance of graphics Render data groups alongside each other for easy comparison Use colors in plots Create network graphs, heat maps, and 3D scatter plots Structure data for graphing -
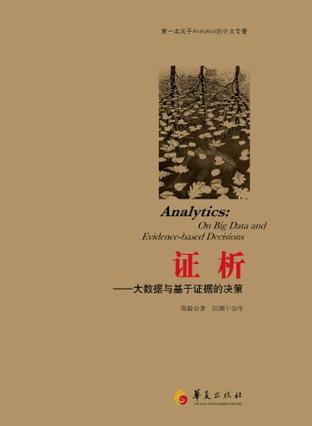
证析
《证析:大数据与基于证据的决策》的主题是Analytics,作者将一个英文新词Analytics译为“证析”借以指代在这个时代背景下对证据尤其是量化证据进行分析以影响决策的具体实践。《证析:大数据与基于证据的决策》更多关注数据对商业与社会领域决策的影响。《证析:大数据与基于证据的决策》在前言部分之外,分为上下两编。上编对证析所处的时代背景、证析对传统决策方式的挑战、证析在企业中的应用案例进行介绍,并着重介绍了实验在指导社会实践中的思想和实例。下编主要从证析对企业的价值、为了发挥证析的价值而在企业组织架构、考核体系、决策流程、组织文化等方面应有的考虑。除了介绍最新的管理思想与企业实践之外,因为证析的着眼点是数字与决策,所以贯穿全书也不可避免会涉及对科学研究方法的探讨。 -
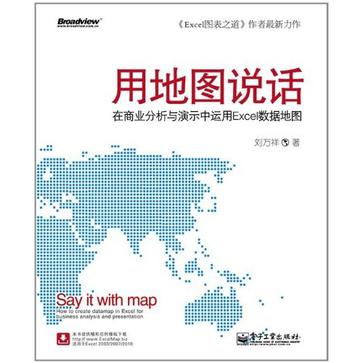
用地图说话
你是否曾对商业杂志上专业的数据地图羡慕不已? 你是否曾想过用数据地图来呈现自己的业务数据? 本书作者通过跟踪学习《华尔街日报》《经济学人》等国外商业网站上各种形式的 数据地图案例,摸索出一整套在Office软件中模仿制作数据地图的方法,本书正是这一 系列数据地图制作 和演示方法的系统总结和阐述,旨在告诉你如何运用常见的Excel软件,制作出媲美商业杂志、具备专业品质的数据地图,以及如何在数据分析和商务演示中加以运用。这些方法精妙绝伦又足够简单,而且作者还提供了包含模板的范例包,可以直接套用,适于从事数据分析与研究人士学习和参考。 -
环境与生态统计
《环境与生态统计:R语言的应用》内容简介:在强调统计思维的归纳性本质基础上,《环境与生态统计:R语言的应用》把应用统计学跟环境与生态领域关联到一起。《环境与生态统计:R语言的应用》遵循解决统计建模问题的一般方法。内容覆盖了模型界定、参数估值和模型评估。作者用了很多实例来阐述统计学模型以及如何用R语言来实现模型。《环境与生态统计:R语言的应用》首先为开展简单的数据分析任务提供了基础知识。例如探索性数据分析和线性回归模型拟合。接下来重点介绍了统计建模,包括线性和非线性模型、分类和回归树以及广义线性模型。书中还讨论了用于模型检验的模拟,为开发出的模型提供评估工具,同时探讨了多层回归模型这类会对环境和生态学数据分析产生广泛影响的模型。 《环境与生态统计:R语言的应用》重点针对的是环境和生态学问题的统计建模和数据分析。通过引导读者理解解决科学问题和开发统计模型的过程,轻松地从科学假设过渡到统计模型。 -
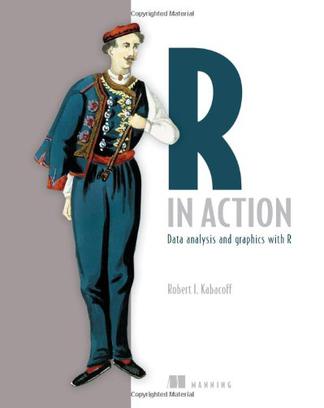
R in Action
The ability to interpret and act on the massive amounts of information locked in web and enterprise systems is critical to success in the modern business economy. R, a free software environment for statistical computing and graphics, is a comprehensive package that empowers developers and analysts to capture, process, and respond intelligently to statistical information. R in Action is the first book to present both the R system and the use cases that make it such a compelling package for business developers. The book begins by introducing the R language, and then moves on to various examples illustrating R's features. Coverage includes data mining methodologies, approaches to messy data, R's extensive graphical environment, useful add-on modules, and how to interface R with other software platforms and data management systems. -
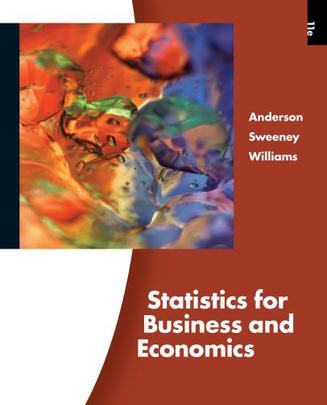
Statistics for Business and Economics
Discover how the most trusted approach to statistics today is Simply Powerful with the latest market-leading text from respected authors Anderson/Sweeney/Williams. STATISTICS FOR BUSINESS AND ECONOMICS, 11e introduces sound statistical methodology within a strong applications setting. The authors clearly demonstrate how statistical results provide insights into business decisions and present solutions to contemporary business problems. New cases and more than 350 real business examples and memorable exercises, 150 of which are new in this edition, present the latest statistical data and business information. With this book's comprehensive coverage and unwavering accuracy, you select the topics best for your course, including thorough coverage of the latest versions of MiniTab 15 and Excel 2007, along with StatTools and other leading Excel 2007 statistical add-ins within chapter appendices. Author-written support materials and CengageNOW online course management system provides time-saving, complete support to ensure student understanding. Choose Anderson/Sweeney/Williams' STATISTICS FOR BUSINESS AND ECONOMICS, 11e for the Simply Powerful statistical solution you need for your course. -
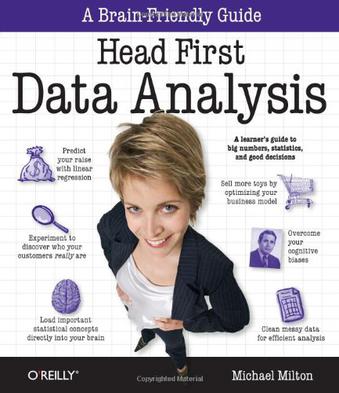
Head First Data Analysis
Today, interpreting data is a critical decision-making factor for businesses and organizations. If your job requires you to manage and analyze all kinds of data, turn to "Head First Data Analysis", where you'll quickly learn how to collect and organize data, sort the distractions from the truth, find meaningful patterns, draw conclusions, predict the future, and present your findings to others. Whether you're a product developer researching the market viability of a new product or service, a marketing manager gauging or predicting the effectiveness of a campaign, a salesperson who needs data to support product presentations, or a lone entrepreneur responsible for all of these data-intensive functions and more, the unique approach in "Head First Data Analysis" is by far the most efficient way to learn what you need to know to convert raw data into a vital business tool. You'll learn how to: determine which data sources to use for collecting information; assess data quality and distinguish signal from noise; build basic data models to illuminate patterns, and assimilate new information into the models; cope with ambiguous information; design experiments to test hypotheses and draw conclusions; use segmentation to organize your data within discrete market groups; visualize data distributions to reveal new relationships and persuade others; predict the future with sampling and probability models; clean your data to make it useful; and, communicate the results of your analysis to your audience. Using the latest research in cognitive science and learning theory to craft a multi-sensory learning experience, "Head First Data Analysis" uses a visually rich format designed for the way your brain works, not a text-heavy approach that puts you to sleep. -
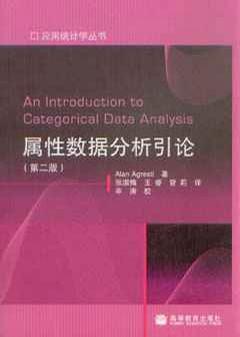
属性数据分析引论
《属性数据分析引论(第2版)》的起点较低,仅仅要求读者具有基础统计课程的知识,包括参数估计、假设检验、回归分析模型及方差分析模型。全书分为十一章,分别介绍了与属性数据有关的统计学基础知识,列联表的相关知识,广义线性模型理论,logistic回归模型的理论、应用及其推广,对数线性模型,配对数据模型,聚簇关联响应的建模,广义线性混合模型以及属性数据分析方法的发展史。 《属性数据分析引论(第2版)》内容详尽而不失精炼,整个体系力求完整而不失紧凑,语言深入浅出,通俗易懂。配备了大量经典案例,每章附有适量习题。这些习题编排精心,由浅人深,能够引导读者进一步凝练正文内容,锻炼解决实际问题的能力。《属性数据分析引论(第2版)》约有100个实际案例,同时附有每种统计方法的SAS及SPSS的实现过程。 -
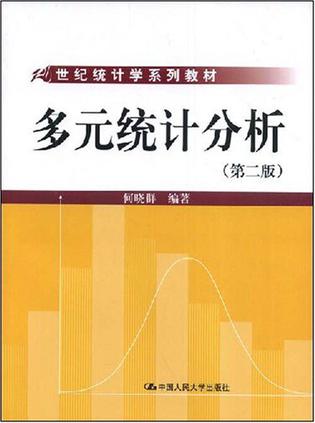
多元统计分析
《多元统计分析》(第2版)写作的指导思想是:在不失严谨的前提下,明显不同于纯数理类教材,努力突出实际案例的应用和统计思想的渗透,结合统计软件较全面地系统介绍多元分析的实用方法。为了贯彻这一思想,《多元统计分析》参考了国内外大量书籍及文献,在系统介绍多元分析基本理论和方法的同时,尽力结合社会、经济、自然科学等领域的研究实例,把多元分析的方法与实际应用结合起来,注意定性分析与定量分析的紧密结合,努力把同行们以及我们在实践中应用多元分析的经验和体会融入其中。几乎每种方法都强调它们各自的优缺点和实际运用中应注意的问题。为使读者掌握《多元统计分析》(第2版)内容,又考虑到这门课程的应用性和实践性,每章后面给出一些简单的思考与练习题。我们鼓励读者自己利用一些实际数据去实现这些方法。多元分析的应用离不开计算机,《多元统计分析》的案例主要运用在我国广泛流行的SPSS软件实现,部分方法用SAS软件完成。《多元统计分析》(第2版)一个显著的特点是在每种方法后结合实例概要介绍了SPSS或SAS软件的实际操作实现过程。在每章后面都注明了参考文献,有兴趣的读者可进一步阅读。
热门标签
下载排行榜
- 1 梦的解析:最佳译本
- 2 李鸿章全传
- 3 淡定的智慧
- 4 心理操控术
- 5 哈佛口才课
- 6 俗世奇人
- 7 日瓦戈医生
- 8 笑死你的逻辑学
- 9 历史老师没教过的历史
- 10 1分钟和陌生人成为朋友


