标签:可视化
-
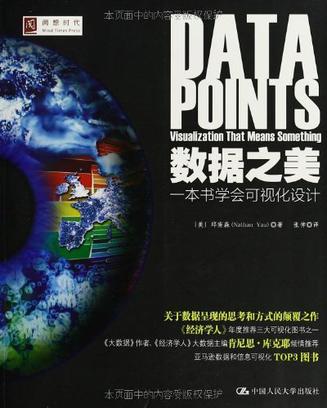
数据之美
这是一本教我们如何制作完美可视化图表,挖掘大数据背后意义的书。作者认为,可视化是一种媒介,向我们揭示了数据背后的故事。他循序渐进、深入浅出地道出了数据可视化的步骤和思想。本书让我们知道了如何理解数据可视化,如何探索数据的模式和寻找数据间的关联,如何选择适合自己的数据和目的的可视化方式,有哪些我们可以利用的可视化工具以及这些工具各有怎样的利弊。 作者给我们提供了丰富的可视化信息以及查看、探索数据的多元视角,丰富了我们对于数据、对于可视化的认知。对那些对设计和分析过程感兴趣的人,本书无疑就是一本必读书。 -
Exploratory Social Network Analysis with Pajek
This is the first textbook on social network analysis integrating theory, applications, and professional software for performing network analysis (Pajek). Pajek software and datasets for all examples are freely available, so the reader can learn network analysis by doing it. In addition, each chapter offers case studies for practicing network analysis. The book will enable the reader to gain the knowledge, skills, and tools to apply social network analysis in all social sciences, ranging from anthropology and sociology to business administration and history. ======== Table of contents Part I. Fundamentals 1. Looking for social structure 2. Attributes and relations Part II. Cohesion 3. Cohesive subgroups 4. Sentiments and friendship 5. Affiliations Part III. Brokerage 6. Center and periphery 7. Brokers and bridges 8. Diffusion Part IV. Ranking 9. Prestige 10. Ranking 11. Genealogies and citations Part V. Roles 12. Blockmodels Appendix 1. Getting started with Pajek Appendix 2. Exporting visualizations Appendix 3. Shortcur Key Combinations -
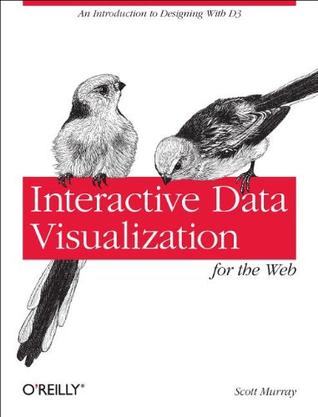
Interactive Data Visualization for the Web
Create and publish your own interactive data visualization projects on the Web, even if you have no experience with either web development or data visualization. It's easy with this hands-on guide. You'll start with an overview of data visualization concepts and simple web technologies, and then learn how to use D3, a JavaScript library that lets you express data as visual elements in a web page. Interactive Data Visualization for the Web makes these skills available at an introductory level for designers and visual artists without programming experience, journalists interested in the emerging data journalism processes, and others keenly interested in visualization and publicly available data sources. Get a practical introduction to data visualization, accessible for beginners Focus on web-based tools that help you publish your creations quickly to a wide audience Learn about interactivity so you can engage users in exploring your data -
可视化数据
这是一本关于计算信息设计的书籍。从如何获取原始数据开始,到如何理解原始数据,本书都作了非常详尽的介绍。书中使用由作者开发的开源编程环境Processing编程,它非常简单易用。对于熟悉Java的程序员来说,本书后面的章节还介绍了如何将Processing和Java结合使用。 本书是写给那些拥有一个数据集合,好奇如何探索它,并且考虑如何交流这些数据的人们的。随着我们处理越来越多的信息,需要可视化数据的人的数量增长非常迅速。更重要的是,读者已经超越了某些可视化领域的专家。通过让更大范围的人接触到可视化思想,在接下来的几十年中应该可以看到一些真正让人惊叹的成果。 -
数据可视化
全书共有16 章,分为4 篇。基础篇,阐述数据可视化的基础理论和概念,从人的感知和认知出发,介绍数据模型和可视化基础;时空数据篇,介绍带有空间坐标或时间信息的数据的可视化方法,此类数据通过设备在真实物理空间中采集得到或由科学计算模拟产生;非时空数据篇,描述非结构化和非几何的抽象数据的可视化,这些数据既存在于真实物理空间,又是社会空间和网络信息空间的基本表达形式;用户篇,介绍面向各类数据的可视化在实际应用中共同需要的方法、技术和工具,例如交互和可视化评测方法,以及在具体领域的可视化和应用系统。 本书从研究者的角度,介绍数据可视化的定义、方法、效用和工具,既可作为初学者的领路手册,也可用于可视化研究和可视化工具使用的参考指南。 -
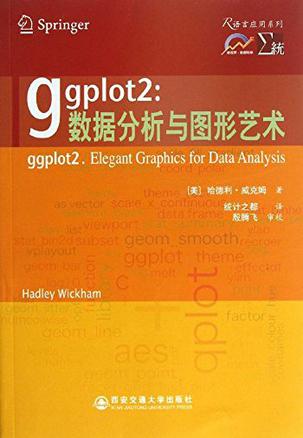
ggplot2:数据分析与图形艺术
中译本序 每当我们看到一个新的软件,第一反应会是:为什么又要发明一个新软件?ggplot2是R世界里相对还比较年轻的一个包,在它之前,官方R已经有自己的基础图形系统(graphics包)和网格图形系统(grid包),并且Deepayan Sarkar也开发了lattice包,看起来R的世界对图形的支持已经足够强大了。那么我们不禁要问,为什么还要发明一套新的系统? 设计理念 打个比方,想想我们小时候怎样学中文的。最开始的时候我们要识字,不认识字就没法阅读和写作,但我们并不是一直按照一个个汉字学习的,而是通过句子和具体的场景故事学习的。为什么不在小学时背六年字典呢?那样可能认识所有的汉字。原因很简单,光有单字,我们不会说话,也无法阅读和写作。缺的是什么?答案是对文字的组织能力,或者说语法。 R的基础图形系统基本上是一个“纸笔模型”,即:一块画布摆在面前,你可以在这里画几个点,在那里画几条线,指哪儿画哪儿。后来lattice包的出现稍微改善了这种情况,你可以说,我要画散点图或直方图,并且按照某个分类变量给图中的元素上色,此时数据才在画图中扮演了一定的中心角色,我们不用去想具体这个点要用什么颜色(颜色会根据变量自动生成)。然而,lattice继承了R语言的一个糟糕特征,就是参数设置铺天盖地,足以让人窒息,光是一份xyplot()函数的帮助文档,恐怕就够我们消磨一天时间了,更重要的是,lattice仍然面向特定的统计图形,像基础图形系统一样,有直方图、箱线图、条形图等等,它没有一套可以让数据分析者说话的语法。 那么数据分析者是怎样说话的呢?他们从来不会说这条线用#FE09BE颜色,那个点用三角形状,他们只会说,把图中的线用数据中的职业类型变量上色,或图中点的形状对应性别变量。有时候他们画了一幅散点图,但马上他们发现这幅图太拥挤,最好是能具体看一下里面不同收入阶层的特征,所以他们会说,把这幅图拆成七幅小图,每幅图对应一个收入阶层。然后发现散点图的趋势不明显,最好加上回归直线,看看回归模型反映的趋势是什么,或者发现图中离群点太多,最好做一下对数变换,减少大数值对图形的主导性。 从始至终,数据分析者都在数据层面上思考问题,而不是拿着水彩笔和调色板在那里一笔一划作图,而计算机程序员则倾向于画点画线。Leland Wilkinson的著作在理论上改善了这种状况,他提出了一套图形语法,让我们在考虑如何构建一幅图形的时候不再陷在具体的图形元素里面,而是把图形拆分为一些互相独立并且可以自由组合的成分。这套语法提出来之后他自己也做了一套软件,但显然这套软件没有被广泛采用;幸运的是,Hadley Wickham在R语言中把这套想法巧妙地实现了。 为了说明这种语法的想法,我们考虑图形中的一个成分:坐标系。常见的坐标系有两种:笛卡尔坐标系和极坐标系。在语法中,它们属于一个成分,可自由拆卸替换。笛卡尔坐标系下的条形图实际上可以对应极坐标系下的饼图,因为条形图的高可以对应饼图的角度,本质上没什么区别。因此在ggplot2中,从一幅条形图过渡到饼图,只需要加极少量的代码,把坐标系换一下就可以了。如果我们用纸笔模型,则可以想象,这完全是不同的两幅图,一幅图里面要画的是矩形,另一幅图要画扇形。 更多的细节在本书中会介绍,这里我们只是简略说明用语法画图对用纸笔画图来说在思维上的优越性;前者是说话,后者是说字。 发展历程 ggplot2是Hadley在爱荷华州立大学博士期间的作品,也是他博士论文的主题之一,实际上ggplot2还有个前身ggplot,但后来废弃了,某种程度上这也是Hadley写软件的特征,熟悉他的人就知道这不是他第一个“2”版本的包了(还有reshape2)。带2的包和原来的包在语法上会有很大的改动,基本上不兼容。尽管如此,他的R代码风格在R社区可谓独树一帜,尤其是他的代码结构很好,可读性很高,ggplot2是R代码抽象的一个杰作。读者若感兴趣,可以在GitHub网站上浏览他的包:https://github.com/hadley。在用法方面,ggplot2也开创了一种奇特而绝妙的语法,那就是加号:一幅图形从背后的设计来说,是若干图形语法的叠加,从外在的代码来看,也是若干R对象的相加。这一点精妙尽管只是ggplot2系统的很小一部分,但我个人认为没有任何程序语言可比拟,它对作为泛型函数的加号的扩展只能用两个字形容:绝了。 至2013年2月26日,ggplot2的邮件列表(http://groups.google.com/group/ggplot2 )订阅成员已达3394人,邮件总数为15185封,已经成为一个丰富、活跃的用户社区。未来ggplot2的发展也将越来越依赖于用户的贡献,这也是很多开源软件最终的走向。 关于版本更新 原书面世之时,ggplot2的版本号是0.8.3,译者开始翻译此书时是0.9.0版本;该版本较之0.8.3,内部做了一些大改动。此后,ggplot2频繁升级,目前版本号是0.9.3,当然这也给本书的翻译过程带来了相当大的麻烦。因为译者不但要修正原书中大量过时的代码、重新画图,还要修正过时的理念,以及处理数次版本更新的影响。所幸,在翻译过程中,译者得到了本书审校殷腾飞博士、ggplot2开发者Hadley Wickham和Wistong Chang的大力帮助。 如果你是老用户,那么可能需要阅读下面的小节。之后ggplot2有过多次更新,尤其是0.9.0之后,ggplot2的绘图速度和帮助文档有了质的飞跃。关于0.9的更新,读者可以从https://github.com/downloads/hadley/ggplot2/guide-col.pdf下载一份细致的说明文档,但原文档比较长,而且有些内部更新问题我们也不一定需要了解,因此这里给一段概述。 ggplot2的帮助文档大大扩充了,过去头疼的问题之一就是一个函数里面不知道有哪些可能的参数,例如theme()函数,现在已经有了详细说明。 新增图例向导函数guide_legend()和guide_colorbar(),前者可以用来指导图例的排版,例如可以安排图例中元素排为n行m列;后者增强了连续变量图例的展示,例如当我们把颜色映射到一个连续变量上时,过去生成的图例是离散的,现在可以用这个函数生成连续颜色的图例(渐变色)。 新增几何对象函数geom_map()(让地图语法变得更简单),geom_raster()(更高效的geom_tile()),geom_dotplot()(一维点图,展示变量密度分布)和geom_violin()(小提琴,实为密度曲线)。 新增统计变换函数stat_summary2d()(在二维网格上计算数据密度),stat_summary_hex()(在六边形“蜂巢”上计算数据密度),stat_bindot()(一维点图密度),stat_ydensity()(密度曲线,用于小提琴图)。 facet_grid()支持X轴和Y轴其中一者可以有自由的刻度(根据数据范围而定),以往要么所有切片使用同样的坐标轴刻度,要么所有都自由。 geom_boxplot()开始支持画箱线图的凹槽(notch),就像R基础图形系统中的boxplot()函数。 新增函数ggmissing()用来展示缺失值的分布,ggorder()按照数据观察顺序先后画折线图,ggstructure()展示数据热图。 另外这次更新涉及到一些函数参数名称的变化,如果旧代码在这个版本中报错说有未使用的参数,那么用户需要再次查看帮助文档,确保输入的参数在函数中存在。在所有这些表面的更新背后,实际上ggplot2很大程度上被重写了,例如开始使用R自带的S3泛型函数设计,以及将过去ggplot2的功能继续模块化为一些独立的包,一个典型的例子就是标度部分的功能被抽象到scales包中,从数据映射到颜色、大小等外观属性可以由这个包直接完成。这种分拆也使得其他开发者可使用过去ggplot2内部的一些功能函数。 0.9.1版本主要解决了0.9.0版本中的一些漏洞。ggplot2在2012年9月4日发布了新的版本0.9.2,其中一些特性和更新有必要提及: 采用了全新的主题(theme)系统,opts()函数已被标记为“不推荐使用”(deprecated),将在未来版本中被取消,取而代之的是theme()函数,主题元素(theme element)由属性列表构成,支持继承,主题之间可以直接进行合并等操作。详情参见wiki页面:https://github.com/wch/ggplot2/wiki/New-theme-system 。 依赖于新的gtable包。 用来更方便地调整修改ggplot2图形中的图元,ggplotGrob()会返回一个gtable类,这个对象可以利用gtable包中提供的函数和接口进行操作。 所有“模板”类型的图形函数,比如plotmatrix(),ggorder()等等,已被标记为“不推荐使用”(deprecated),将在未来版本中取消。 在本书出版之际,ggplot2更新到了版本0.9.3,修复了0.9.2的一些漏洞,其主要更新包括 不再支持plotmatrix()函数。 geom_polygon()提速,比如世界地图的绘制快了12倍左右。 新增部分主题,比如theme_minimal(),theme_classic()。 本书的所有代码和图片都是针对新版本0.9.3的,在内容方面也根据版本更新对原文做了适当的增删填补,以满足读者的需求。 本书把影响正文阅读的彩图集中放在附录后面,读者可以随时翻阅。 致谢 在听说我们翻译完这本书之后,本书原著Hadley很高兴,给我们发邮件说: I am excited and honoured to have my book translated to Chinese. ggplot2 has become far more popular than I ever imagined, and I'm excited that this translation will allow many more people to learn ggplot2. I'm very grateful that Yihui and his team of translators (Nan Xiao, Tao Gao, Yixuan Qiu, Weicheng Zhu, Taiyun Wei and Lanfeng Pan) made this possible. One of the biggest improvements to ggplot2 since the book was first written is the ggplot2 mailing list. This is a very friendly environment where you can get help with your visualisations, and improve your own knowledge of ggplot2 by helping others solve their problems. I'd strongly encourage you to join the mailing list, even if you think your English is not very good -- we are very friendly people. 我们感谢这本书的译者,包括邱怡轩(第1~2章)、主伟呈(第3~4章)、肖楠(第5~6章)、高涛(第7~8章)、潘岚锋(第9章)、魏太云(第10章、附录以及翻译过程的协调安排和全书的LaTeX排版工作)。所有译者均来自于统计之都(http://cos.name )。 爱荷华州立大学的殷腾飞博士、中国人民大学统计学院的孟生旺教授、浙江大学的张政同学通读了译稿,提出了很多有用的建议,殷腾飞博士还提供了大多数新版本中的解决方案,并担任本书的审校。肖凯老师和余光创博士分别对第1~4章、第8~10章以及附录提出了很多修改意见,此外,中国人民大学的陈妍、李晓矛、谢漫锜三位同学、中国再保险公司的李皞先生、百度公司的韩帅先生、eBay公司的陈丽云女士、Mango Solutions公司的李舰先生、京东商城的刘思喆先生、首钢总公司的邓一硕先生、新华社的陈堰平先生在此书的翻译过程中也曾提过不少宝贵的建议,在此一并表示感谢。 为了更好地服务社区,我们还建立了翻译主页:https://github.com/cosname/ggplot2-translation ,读者可以在这里得到最新的勘误和书中的代码,也可以随时提出任何问题。 谢益辉 2013年2月26日 -
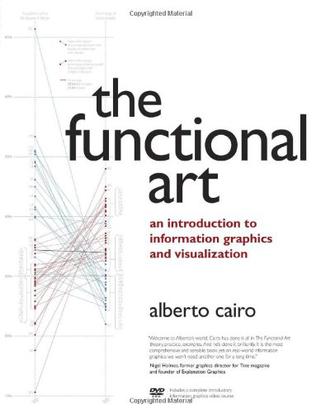
The Functional Art
Unlike any time before in our lives, we have access to vast amounts of free information. With the right tools, we can start to make sense of all this data to see patterns and trends that would otherwise be invisible to us. By transforming numbers into graphical shapes, we allow readers to understand the stories those numbers hide. In this practical introduction to understanding and using information graphics, you'll learn how to use data visualizations as tools to see beyond lists of numbers and variables and achieve new insights into the complex world around us. Regardless of the kind of data you're working with-business, science, politics, sports, or even your own personal finances-this book will show you how to use statistical charts, maps, and explanation diagrams to spot the stories in the data and learn new things from it. You'll also get to peek into the creative process of some of the world's most talented designers and visual journalists, including Conde Nast Traveler's John Grimwade, National Geographic Magazine's Fernando Baptista, The New York Times' Steve Duenes, The Washington Post's Hannah Fairfield, Hans Rosling of the Gapminder Foundation, Stanford's Geoff McGhee, and European superstars Moritz Stefaner, Jan Willem Tulp, Stefanie Posavec, and Gregor Aisch. The book also includes a DVD-ROM containing over 90 minutes of video lessons that expand on core concepts explained within the book and includes even more inspirational information graphics from the world's leading designers. The first book to offer a broad, hands-on introduction to information graphics and visualization, The Functional Art reveals: * Why data visualization should be thought of as "functional art" rather than fine art * How to use color, type, and other graphic tools to make your information graphics more effective, not just better looking * The science of how our brains perceive and remember information * Best practices for creating interactive information graphics * A comprehensive look at the creative process behind successful information graphics * An extensive gallery of inspirational work from the world's top designers and visual artists On the DVD-ROM: In this introductory video course on information graphics, Alberto Cairo goes into greater detail with even more visual examples of how to create effective information graphics that function as practical tools for aiding perception. You'll learn how to: incorporate basic design principles in your visualizations, create simple interfaces for interactive graphics, and choose the appropriate type of graphic forms for your data. Cairo also deconstructs successful information graphics from The New York Times and National Geographic magazine with sketches and images not shown in the book.
-
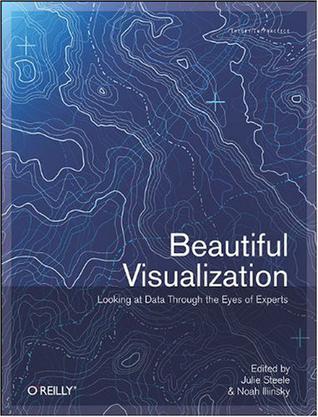
Beautiful Visualization
Visualization is the graphic presentation of data -- portrayals meant to reveal complex information at a glance. Think of the familiar map of the New York City subway system, or a diagram of the human brain. Successful visualizations are beautiful not only for their aesthetic design, but also for elegant layers of detail that efficiently generate insight and new understanding. This book examines the methods of two dozen visualization experts who approach their projects from a variety of perspectives -- as artists, designers, commentators, scientists, analysts, statisticians, and more. Together they demonstrate how visualization can help us make sense of the world. Explore the importance of storytelling with a simple visualization exercise Learn how color conveys information that our brains recognize before we're fully aware of it Discover how the books we buy and the people we associate with reveal clues to our deeper selves Recognize a method to the madness of air travel with a visualization of civilian air traffic Find out how researchers investigate unknown phenomena, from initial sketches to published papers Contributors include: Nick Bilton, Michael E. Driscoll, Jonathan Feinberg, Danyel Fisher, Jessica Hagy, Gregor Hochmuth, Todd Holloway, Noah Iliinsky, Eddie Jabbour, Valdean Klump, Aaron Koblin, Robert Kosara, Valdis Krebs, JoAnn Kuchera-Morin et al., Andrew Odewahn, Adam Perer, Anders Persson, Maximilian Schich, Matthias Shapiro, Julie Steele, Moritz Stefaner, Jer Thorp, Fernanda Viegas, Martin Wattenberg, and Michael Young. -
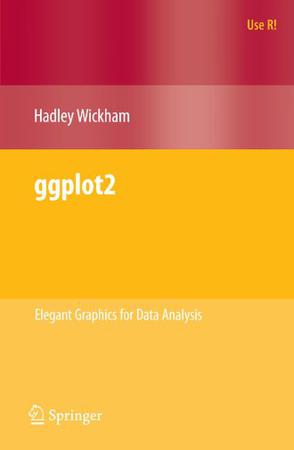
ggplot2
This book describes ggplot2, a new data visualization package for R that uses the insights from Leland Wilkison''s Grammar of Graphics to create a powerful and flexible system for creating data graphics. With ggplot2, it''s easy to: * produce handsome, publication-quality plots, with automatic legends created from the plot specification * superpose multiple layers (points, lines, maps, tiles, box plots to name a few) from different data sources, with automatically adjusted common scales * add customisable smoothers that use the powerful modelling capabilities of R, such as loess, linear models, generalised additive models and robust regression * save any ggplot2 plot (or part thereof) for later modification or reuse * create custom themes that capture in-house or journal style requirements, and that can easily be applied to multiple plots * approach your graph from a visual perspective, thinking about how each component of the data is represented on the final plot. This book will be useful to everyone who has struggled with displaying their data in an informative and attractive way. You will need some basic knowledge of R (i.e. you should be able to get your data into R), but ggplot2 is a mini-language specifically tailored for producing graphics, and you''ll learn everything you need in the book. After reading this book you''ll be able to produce graphics customized precisely for your problems, and you''ll find it easy to get graphics out of your head and on to the screen or page. -
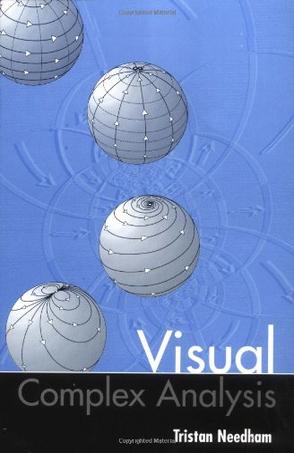
Visual Complex Analysis
Now available in paperback, this successful radical approach to complex analysis replaces the standard calculational arguments with new geometric ones. With several hundred diagrams, and far fewer prerequisites than usual, this is the first visual intuitive introduction to complex analysis. Although designed for use by undergraduates in mathematics and science, the novelty of the approach will also interest professional mathematicians. -
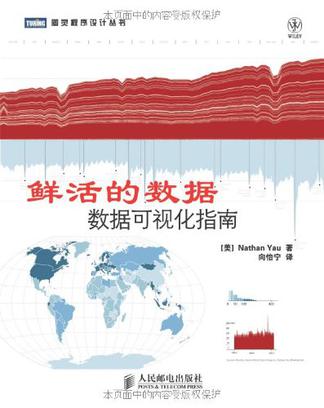
鲜活的数据
在生活中,数据几乎无处不在,任我们取用。然而,同样的数据给人的感觉可能会千差万别:或冰冷枯燥,让人望而生畏、百思不解其意;或生动有趣,让人一目了然、豁然开朗。为了达到后一种效果,我们需要采用一种特别的方式来展示数据,来解释、分析和应用它。这就是数据可视化技术。Nath an Yau是这一创新领域的先锋。在本书中,他根据数据可视化的工作流程,先后介绍了如何获取数据,将数据格式化,用可视化工具(如R)生成图表,以及在图形编辑软件(如Illustrator)中修改以使图表达到最佳效果。本书介绍了数十种方法(如柱形图、饼图、折线图和散点图等),以创造性的视觉方式生动讲述了有关数据的故事。 -
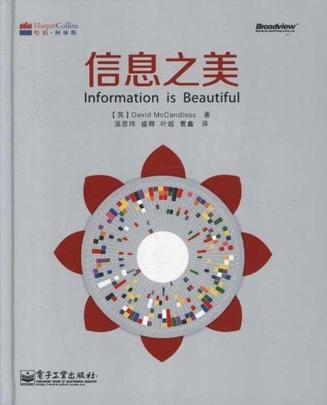
信息之美
《信息之美》告诉读者信息视觉效果的显示和信息如何关联,以及和这些信息相关的事实,让信息设计更有意思,信息决策更高效。我们生活在一个信息爆炸的时代,每一分钟、每一秒钟都会从电视、报纸或互联网获得信息,我们甚至都来不及思索,就已经被这些信息淹没。所以,我们需要一种新的方法,来发现信息的美和乐趣。《信息之美》作者花了一年的时间,收集了200多个新的图像信息设计案例,并探索出一系列视觉主题。 -
可视化未来
科学的传播速度有多快?今时今日我们很少谈论上帝了吗?人们什么时候开始用“having sex” 而不用“making love”? 史上的人是在哪岁成名的?语法的变化速度到底有多快?哪些作家被纳粹审查得最彻底? “donut” 什么时候开始取代“doughnut”? 我 们能否预测人类未来?比尔·克林顿和花椰菜哪个更出名? 《可视化未来》一书的两位作者通过与“谷歌图书”的合作,得以有机会研究500多万本电子书,而成果是一个科学工具——n元词组词频查看器。通过它,我们可以一探恒星的运动轨迹,用图表去研究人类历史在几个世纪来的发展趋势,从而为我们提供了一个新的理解世界过往、可能性和未来的视角。 该书是史蒂芬·平克最为推崇的人文趋势新作,500多万本电子书、82幅图表、6大热点主题,完美洞悉人文历史与未来。 -
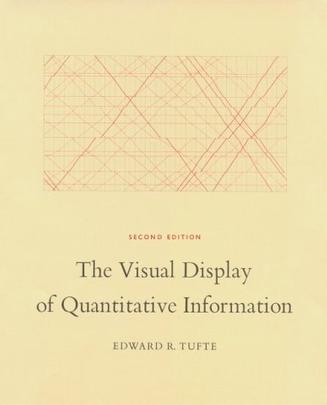
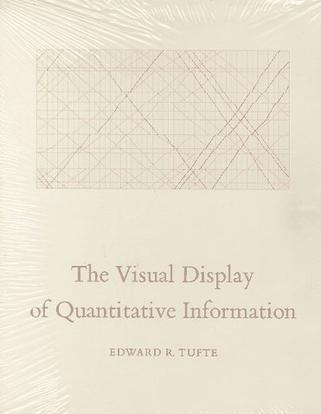
The Visual Display of Quantitative Information
The classic book on statistical graphics, charts, tables. Theory and practice in the design of data graphics, 250 illustrations of the best (and a few of the worst) statistical graphics, with detailed analysis of how to display data for precise, effective, quick analysis. Design of the high-resolution displays, small multiples. Editing and improving graphics. The data-ink ratio. Time-series, relational graphics, data maps, multivariate designs. Detection of graphical deception: design variation vs. data variation. Sources of deception. Aesthetics and data graphical displays. This is the second edition of The Visual Display of Quantitative Information. Recently published, this new edition provides excellent color reproductions of the many graphics of William Playfair, adds color to other images, and includes all the changes and corrections accumulated during 17 printings of the first edition. This book celebrates escapes from the flatlands of both paper and computer screen, showing superb displays of high-dimensional complex data. The most design-oriented of Edward Tufte's books, Envisioning Information shows maps, charts, scientific presentations, diagrams, computer interfaces, statistical graphics and tables, stereo photographs, guidebooks, courtroom exhibits, timetables, use of color, a pop-up, and many other wonderful displays of information. The book provides practical advice about how to explain complex material by visual means, with extraordinary examples to illustrate the fundamental principles of information displays. Topics include escaping flatland, color and information, micro/macro designs, layering and separation, small multiples, and narratives. Winner of 17 awards for design and content. 400 illustrations with exquisite 6- to 12-color printing throughout. Highest quality design and production. Visual Explanations: Images and Quantities, Evidence and Narrative is about pictures of verbs, the representation of mechanism and motion, process and dynamics, causes and effects, explanation and narrative. Practical applications and examples include statistical graphics, charts for making important decisions in engineering and medicine, technical manuals, diagrams, design of computer interfaces and websites and on-line manuals, animations and scientific visualizations, techniques for talks, and design strategies for enhancing the rate of information transfer in print, presentations, and computer screens. The use of visual evidence in deciding to launch the space shuttle Challenger is discussed in careful detail. Video snapshots show redesigns of a supercomputer animation of a thunderstorm. The book is designed and printed to the highest standards, with luscious color throughout and four built-in flaps for showing motion and before/after effects. -
爱上Processing
Processing最初是面向艺术家和设计师开发的程序。由Casey Reas和Ben Fry编著的《爱上Processing》适合零基础的初学者。《爱上Processing》的1~6章介绍了Processing的基础用法,而7~10章则结合计算机高级编程语言的基础知识,通过示例让初学者更加透彻地理解编程的逻辑思路以及语言。第11章结合Arduino物理模块进行了延伸。《爱上Processing》与《爱上Arduino》一书相呼应,向大家展现了Processing的强大拓展性和创造性。 -
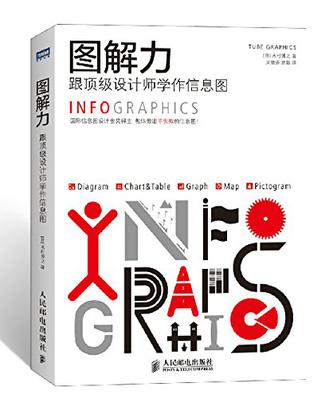
图解力
国际信息图设计金奖得主 教你做出不失败的信息图! ================================= 读图时代,你必须有这本! ◎72个章节,剖析图解一切信息的法则 ◎168幅图例,照葫芦画瓢,立马上手 ◎穿插国际设计大师的作品,榜样正能量 本书将信息图的呈现方式分为:图解(Diagram)、图表(Chart)、表格(Table)、统计图(Graph)、地图(Map)、图形符号(Pictogram) 。结合丰富的案例,分别介绍了信息图设计的72 个技巧和需要注意的问题。本书直观形象、通俗易懂,具有极强的实践 指导作用。 本书适合各行业进行信息呈现的设计人员阅读。 -
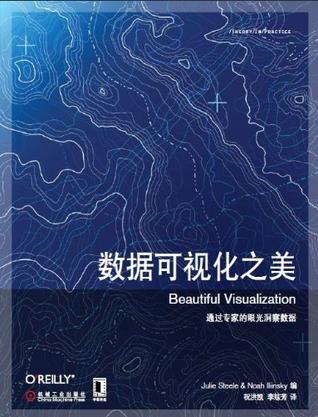
数据可视化之美
《数据可视化之美》内容简介:可视化是数据描述的图形表示,旨在一目了然地揭示数据中的复杂信息。可视化的典型如纽约地铁图和人脑图。成功的可视化的美丽之处既在于其艺术设计,也在于其通过对细节的优雅展示,能够有效地产生对数据的洞察和新的理解。 在《数据可视化之美》中,20多位可视化专家包括艺术家、设计师、评论家、科学家、分析师、统计学家等,展示了他们如何在各自的学科领域内开展项目。他们共同展示了可视化所能实现的功能以及如何使用它来改变世界。在《数据可视化之美》中,你将: 通过简单的可视化实践探索讲故事的重要性。 了解颜色如何传达我们尚未充分意识到而大脑已经识别出的信息。 发现我们购买的书籍和我们的交际圈如何揭示内心的自我。 通过对民航交通的可视化探索识别航空旅行的混乱的一种方法。 揭秘研究人员如何调查未知问题,包括从最初的草图到发表的论文。 点击链接进入o'reilly之美系列: 《代码之美》 《项目管理之美》 《架构之美》 《团队之美》 《测试之美》 《数据之美》 《安全之美》 《数据可视化之美》 -
图形对话
该书系统的介绍了信息设计——这一新兴知识,收录了300多张高清图片。 以及荷兰、意大利、日本、中国、英国的信息设计师访谈。会让你真正地了解信息设计。 该书系统的介绍了信息设计——这一新兴知识,收录了300多张高清图片。以及荷兰、意大利、日本、中国、英国的信息设计师访谈。会让你真正地了解信息设计。 信息设计的表现形式很多,以数据视觉化为主,因此也被称为信息图形设计,不少人理解为图表设计。信息设计作为沟通的有效手段,需要理解文化和信息设计之间的关系。信息设计的要点是清晰准确、易于理解、美观。本书提倡用理性的思维进行设计,将设计看做一个循序渐进的过程,而不仅仅是一个漂亮的结果。用大量的案例来说明信息设计的多元化和功能性,为您打开一扇新的设计之门。 什么是信息设计? 信息设计有什么其他名称? 信息设计的发展历史是什么? 和信息设计相关的学科有哪些? 信息设计的分类是什么? 如何进行信息设计? 知名和新锐信息设计师对信息设计的理解是什么? 信息设计的案例怎样解读? 本书将——为您解答这些问题。 -
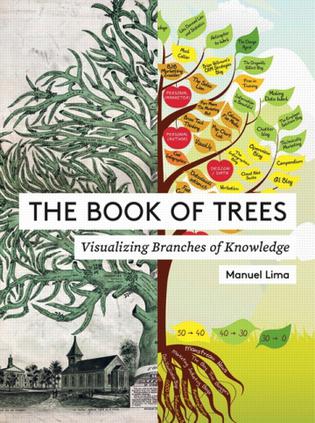
The Book of Trees
Our critically acclaimed bestseller Visual Complexity was the first in-depth examination of the burgeoning field of information visualization. Particularly noteworthy are the numerous historical examples of past efforts to make sense of complex systems of information. In this new companion volume, The Book of Trees, data viz expert Manuel Lima examines the more than eight hundred year history of the tree diagram, from its roots in the illuminated manuscripts of medieval monasteries to its current resurgence as an elegant means of visualization. Lima presents two hundred intricately detailed tree diagram illustrations on a remarkable variety of subjects, from some of the earliest known examples from ancient Mesopotamia to the manuscripts of medieval monasteries to contributions by leading contemporary designers. A timeline of capsule biographies on key figures in the development of the tree diagram rounds out this one-of-a-kind visual compendium. -Tree diagrams suggest strategies for representing data across many disciplines, including science, law, geneology, linguistics, economics, and sociology -Includes fascinating examples, such as early conceptualizations of heaven and hell, kinship diagrams of kings of France and West Virginian mountaineers, and analyses of recipe ingredients'
热门标签
下载排行榜
- 1 梦的解析:最佳译本
- 2 李鸿章全传
- 3 淡定的智慧
- 4 心理操控术
- 5 哈佛口才课
- 6 俗世奇人
- 7 日瓦戈医生
- 8 笑死你的逻辑学
- 9 历史老师没教过的历史
- 10 1分钟和陌生人成为朋友

