欢迎来到相识电子书!
标签:可视化
-
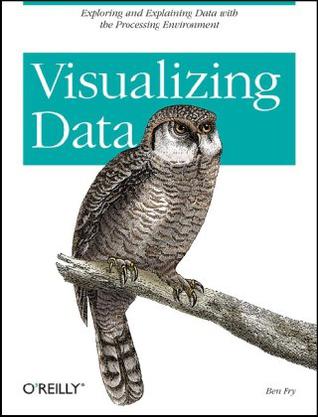
Visualizing Data
Enormous quantities of data go unused or underused today, simply because people can't visualize the quantities and relationships in it. Using a downloadable programming environment developed by the author, Visualizing Data demonstrates methods for representing data accurately on the Web and elsewhere, complete with user interaction, animation, and more. How do the 3.1 billion A, C, G and T letters of the human genome compare to those of a chimp or a mouse? What do the paths that millions of visitors take through a web site look like? With Visualizing Data, you learn how to answer complex questions like these with thoroughly interactive displays. We're not talking about cookie-cutter charts and graphs. This book teaches you how to design entire interfaces around large, complex data sets with the help of a powerful new design and prototyping tool called "Processing". Used by many researchers and companies to convey specific data in a clear and understandable manner, the Processing beta is available free. With this tool and Visualizing Data as a guide, you'll learn basic visualization principles, how to choose the right kind of display for your purposes, and how to provide interactive features that will bring users to your site over and over. This book teaches you: * The seven stages of visualizing data -- acquire, parse, filter, mine, represent, refine, and interact * How all data problems begin with a question and end with a narrative construct that provides a clear answer without extraneous details * Several example projects with the code to make them work * Positive and negative points of each representation discussed. The focus is on customization so that each one best suits what you want to convey about your data set The book does not provide ready-made "visualizations" that can be plugged into any data set. Instead, with chapters divided by types of data rather than types of display, you'll learn how each visualization conveys the unique properties of the data it represents -- why the data was collected, what's interesting about it, and what stories it can tell. Visualizing Data teaches you how to answer questions, not simply display information. -
谁说菜鸟不会数据分析
《谁说菜鸟不会数据分析(全彩)》内容简介:很多人看到数据分析就望而却步,担心门槛高,无法迈入数据分析的门槛。《谁说菜鸟不会数据分析(全彩)》在降低学习难度方面做了大量的尝试:基于通用的Excel工具,加上必知必会的数据分析概念,并且采用通俗易懂的讲解方式。《谁说菜鸟不会数据分析(全彩)》努力将数据分析写成像小说一样通俗易懂,使读者可以在无形之中学会数据分析。《谁说菜鸟不会数据分析(全彩)》按照数据分析工作的完整流程来讲解。全书共8章,分别讲解数据分析必知必会的知识、数据处理技巧、数据展现的技术、通过专业化的视角来提升图表之美、数据分析报告的撰写技能以及持续的修炼。 《谁说菜鸟不会数据分析(全彩)》形式活泼,内容丰富而且充实,让人有不断阅读下去的动力。读者完全可以把《谁说菜鸟不会数据分析(全彩)》当小说来阅读,跟随主人公小白,在Mr.林的指点下轻松掌握数据分析的技能,提升职场竞争能力。 《谁说菜鸟不会数据分析(全彩)》适合需要提升自身竞争力的职场新人;在市场营销、金融、财务、人力资源管理中需要作数据分析的人士;经常阅读经营分析、市场研究报告的各级管理人员;从事咨询、研究、分析等专业人士。
热门标签
下载排行榜
- 1 梦的解析:最佳译本
- 2 李鸿章全传
- 3 淡定的智慧
- 4 心理操控术
- 5 哈佛口才课
- 6 俗世奇人
- 7 日瓦戈医生
- 8 笑死你的逻辑学
- 9 历史老师没教过的历史
- 10 1分钟和陌生人成为朋友


