标签:数据可视化
-
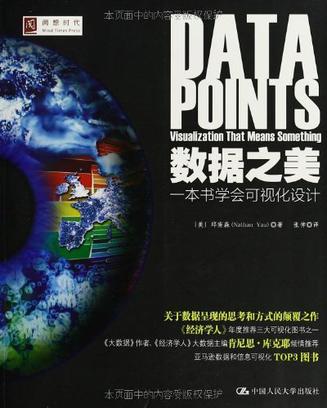
数据之美
这是一本教我们如何制作完美可视化图表,挖掘大数据背后意义的书。作者认为,可视化是一种媒介,向我们揭示了数据背后的故事。他循序渐进、深入浅出地道出了数据可视化的步骤和思想。本书让我们知道了如何理解数据可视化,如何探索数据的模式和寻找数据间的关联,如何选择适合自己的数据和目的的可视化方式,有哪些我们可以利用的可视化工具以及这些工具各有怎样的利弊。 作者给我们提供了丰富的可视化信息以及查看、探索数据的多元视角,丰富了我们对于数据、对于可视化的认知。对那些对设计和分析过程感兴趣的人,本书无疑就是一本必读书。 -
R语言实战
数据时代已经到来,但数据分析、数据挖掘人才却十分短缺。由于“大数据”对每个领域的决定性影响, 相对于经验和直觉,在商业、经济及其他领域中基于数据和分析去发现问题并作出科学、客观的决策越来越重要。开源软件R是世界上最流行的数据分析、统计计算及制图语言,几乎能够完成任何数据处理任务,可安装并运行于所有主流平台,为我们提供了成千上万的专业模块和实用工具,是从大数据中获取有用信息的绝佳工具。 本书从解决实际问题入手,尽量跳脱统计学的理论阐述来讨论R语言及其应用,讲解清晰透澈,极具实用性。作者不仅高度概括了R语言的强大功能、展示了各种实用的统计示例,而且对于难以用传统方法分析的凌乱、不完整和非正态的数据也给出了完备的处理方法。通读本书,你将全面掌握使用R语言进行数据分析、数据挖掘的技巧,并领略大量探索和展示数据的图形功能,从而更加高效地进行分析与沟通。想要成为倍受高科技企业追捧的、炙手可热的数据分析师吗?想要科学分析数据并正确决策吗?不妨从本书开始,挑战大数据,用R开始炫酷的数据统计与分析吧! 本书内容: R安装与操作 数据导入/导出及格式化双变量关系的描述性分析回归分析 模型适用性的评价方法以及结果的可视化 用图形实现变量关系的可视化 在给定置信度的前提下确定样本量 高级统计分析方法和高级绘图 -
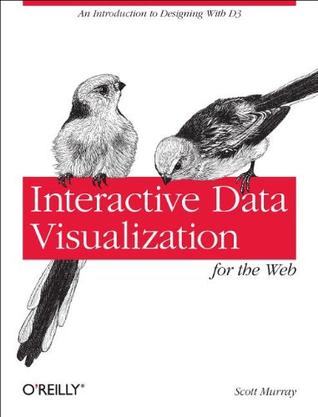
Interactive Data Visualization for the Web
Create and publish your own interactive data visualization projects on the Web, even if you have no experience with either web development or data visualization. It's easy with this hands-on guide. You'll start with an overview of data visualization concepts and simple web technologies, and then learn how to use D3, a JavaScript library that lets you express data as visual elements in a web page. Interactive Data Visualization for the Web makes these skills available at an introductory level for designers and visual artists without programming experience, journalists interested in the emerging data journalism processes, and others keenly interested in visualization and publicly available data sources. Get a practical introduction to data visualization, accessible for beginners Focus on web-based tools that help you publish your creations quickly to a wide audience Learn about interactivity so you can engage users in exploring your data -
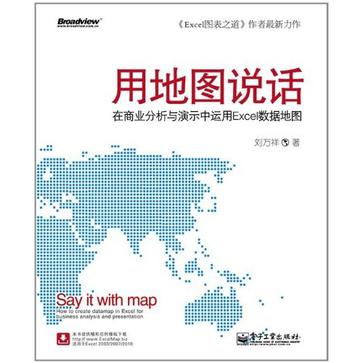
用地图说话
你是否曾对商业杂志上专业的数据地图羡慕不已? 你是否曾想过用数据地图来呈现自己的业务数据? 本书作者通过跟踪学习《华尔街日报》《经济学人》等国外商业网站上各种形式的 数据地图案例,摸索出一整套在Office软件中模仿制作数据地图的方法,本书正是这一 系列数据地图制作 和演示方法的系统总结和阐述,旨在告诉你如何运用常见的Excel软件,制作出媲美商业杂志、具备专业品质的数据地图,以及如何在数据分析和商务演示中加以运用。这些方法精妙绝伦又足够简单,而且作者还提供了包含模板的范例包,可以直接套用,适于从事数据分析与研究人士学习和参考。 -
数据可视化
全书共有16 章,分为4 篇。基础篇,阐述数据可视化的基础理论和概念,从人的感知和认知出发,介绍数据模型和可视化基础;时空数据篇,介绍带有空间坐标或时间信息的数据的可视化方法,此类数据通过设备在真实物理空间中采集得到或由科学计算模拟产生;非时空数据篇,描述非结构化和非几何的抽象数据的可视化,这些数据既存在于真实物理空间,又是社会空间和网络信息空间的基本表达形式;用户篇,介绍面向各类数据的可视化在实际应用中共同需要的方法、技术和工具,例如交互和可视化评测方法,以及在具体领域的可视化和应用系统。 本书从研究者的角度,介绍数据可视化的定义、方法、效用和工具,既可作为初学者的领路手册,也可用于可视化研究和可视化工具使用的参考指南。 -
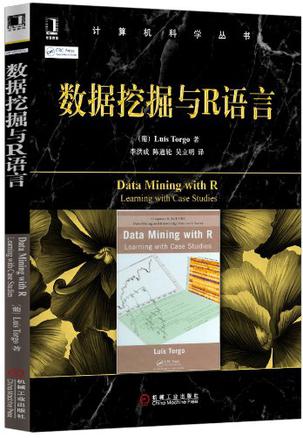
数据挖掘与R语言
“如果你想学习如何用一款统计专家和数据挖掘专家所开发的免费软件包,那就选这本书吧。本书包括大量实际案例,它们充分体现了R软件的广度和深度。” —— Bernhard Pfahringer, 新西兰怀卡托大学 本书利用大量给出必要步骤、代码和数据的具体案例,详细描述了数据挖掘的主要过程和技术,广泛涵盖数据大小、数据类型、分析目标、分析工具等方面的各种具有挑战性的问题。 本书的支持网站(http://www.liaad.up.pt/~ltorgo/DataMiningWithR/)给出了案例研究的所有代码、数据集以及R函数包。 本书特色 通过仔细选择的案例涵盖了主要的数据挖掘技术。 给出的代码和方法可以方便地复制或者改编后应用于自己的问题。 不要求读者具有R、数据挖掘或统计技术的基础知识。 包含R和MySQL基础知识的简介。 提供了对数据挖掘技术的特性、缺点和分析目标的基本理解。 -
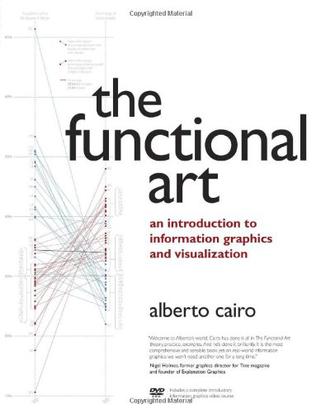
The Functional Art
Unlike any time before in our lives, we have access to vast amounts of free information. With the right tools, we can start to make sense of all this data to see patterns and trends that would otherwise be invisible to us. By transforming numbers into graphical shapes, we allow readers to understand the stories those numbers hide. In this practical introduction to understanding and using information graphics, you'll learn how to use data visualizations as tools to see beyond lists of numbers and variables and achieve new insights into the complex world around us. Regardless of the kind of data you're working with-business, science, politics, sports, or even your own personal finances-this book will show you how to use statistical charts, maps, and explanation diagrams to spot the stories in the data and learn new things from it. You'll also get to peek into the creative process of some of the world's most talented designers and visual journalists, including Conde Nast Traveler's John Grimwade, National Geographic Magazine's Fernando Baptista, The New York Times' Steve Duenes, The Washington Post's Hannah Fairfield, Hans Rosling of the Gapminder Foundation, Stanford's Geoff McGhee, and European superstars Moritz Stefaner, Jan Willem Tulp, Stefanie Posavec, and Gregor Aisch. The book also includes a DVD-ROM containing over 90 minutes of video lessons that expand on core concepts explained within the book and includes even more inspirational information graphics from the world's leading designers. The first book to offer a broad, hands-on introduction to information graphics and visualization, The Functional Art reveals: * Why data visualization should be thought of as "functional art" rather than fine art * How to use color, type, and other graphic tools to make your information graphics more effective, not just better looking * The science of how our brains perceive and remember information * Best practices for creating interactive information graphics * A comprehensive look at the creative process behind successful information graphics * An extensive gallery of inspirational work from the world's top designers and visual artists On the DVD-ROM: In this introductory video course on information graphics, Alberto Cairo goes into greater detail with even more visual examples of how to create effective information graphics that function as practical tools for aiding perception. You'll learn how to: incorporate basic design principles in your visualizations, create simple interfaces for interactive graphics, and choose the appropriate type of graphic forms for your data. Cairo also deconstructs successful information graphics from The New York Times and National Geographic magazine with sketches and images not shown in the book.
-
Designing Data Visualizations
Data visualization is an efficient and effective medium for communicating large amounts of information. But the design process can often seem like an unexplainable creative endeavor. This book aims to demystify the design process for those who are already comfortable with data analysis, showing the reader how to encode information visually via a linear process of decision-making. -
Beautiful Visualization
Visualization is the graphic presentation of data -- portrayals meant to reveal complex information at a glance. Think of the familiar map of the New York City subway system, or a diagram of the human brain. Successful visualizations are beautiful not only for their aesthetic design, but also for elegant layers of detail that efficiently generate insight and new understanding. This book examines the methods of two dozen visualization experts who approach their projects from a variety of perspectives -- as artists, designers, commentators, scientists, analysts, statisticians, and more. Together they demonstrate how visualization can help us make sense of the world. Explore the importance of storytelling with a simple visualization exercise Learn how color conveys information that our brains recognize before we're fully aware of it Discover how the books we buy and the people we associate with reveal clues to our deeper selves Recognize a method to the madness of air travel with a visualization of civilian air traffic Find out how researchers investigate unknown phenomena, from initial sketches to published papers Contributors include: Nick Bilton, Michael E. Driscoll, Jonathan Feinberg, Danyel Fisher, Jessica Hagy, Gregor Hochmuth, Todd Holloway, Noah Iliinsky, Eddie Jabbour, Valdean Klump, Aaron Koblin, Robert Kosara, Valdis Krebs, JoAnn Kuchera-Morin et al., Andrew Odewahn, Adam Perer, Anders Persson, Maximilian Schich, Matthias Shapiro, Julie Steele, Moritz Stefaner, Jer Thorp, Fernanda Viegas, Martin Wattenberg, and Michael Young. -
数据新闻大趋势
本书是英国《卫报》数据新闻实践的最佳蓝本,数据新闻和数据可视化领域的代表性著作, 由现Google趋势数据主编分析师,《卫报》“数据博客”前任主编西蒙·罗杰斯撰写。罗杰斯亲述数据新闻一线工作者从业经验,并将《卫报》2006年-2012年制作的众多经典案例汇入其中,全方位展现了数据新闻媒体、数据新闻记者的工作状态,可谓是“媒体人必读的数据新闻领域的巅峰之作”。 通过书中生动、美丽的数据可视化作品,你能看到《卫报》是如何解读英国政府的财政开支,如何与维基解密合作解读阿富汗、伊拉克战争日志,如何以创新性的角度报道伦敦奥运会……你能看到数据新闻让我们开始以全新的方式看待世界,而它也终将改变世界。 -
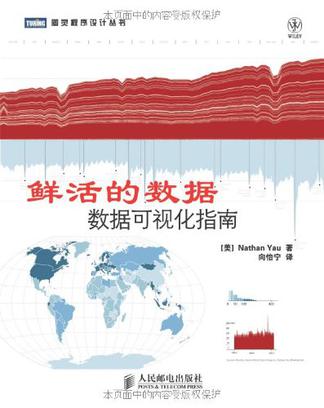
鲜活的数据
在生活中,数据几乎无处不在,任我们取用。然而,同样的数据给人的感觉可能会千差万别:或冰冷枯燥,让人望而生畏、百思不解其意;或生动有趣,让人一目了然、豁然开朗。为了达到后一种效果,我们需要采用一种特别的方式来展示数据,来解释、分析和应用它。这就是数据可视化技术。Nath an Yau是这一创新领域的先锋。在本书中,他根据数据可视化的工作流程,先后介绍了如何获取数据,将数据格式化,用可视化工具(如R)生成图表,以及在图形编辑软件(如Illustrator)中修改以使图表达到最佳效果。本书介绍了数十种方法(如柱形图、饼图、折线图和散点图等),以创造性的视觉方式生动讲述了有关数据的故事。 -
设计中的视觉思维
《设计中的视觉思维》主要介绍视觉思维的原理,并用这些原理来指导视觉图像的设计。哪些颜色和形状比较突出和醒目、在什么样的情况下应用图像来代替文字等都是设计细节中需要考虑的问题,而这些细节往往可以影响一个设计方案的成败。书中顺序介绍了人的视觉生理结构、影响人视觉思维的设计要素,以及如何有效地利用各种设计要素有效地影响人对设计的感受。《设计中的视觉思维》可作为视觉媒体设计人员、互联网图形设计人员的参考用书。设计人员更多地需要以辅助受众思维过程的方式来呈现信息。幸运的是,与人类视觉感知相夭的科学研究结果为此提供了可用的指南。作者将我们现在所知的感知、认知和注意力转化为设计人员可以直接应用的具体建议。他阐述如何将设计作为认知工具来扩展观众的思维——就像用锤子扩展人手一样。有经验的专业设计人员和学生都应该学习一下,在为人们设计信息工具时,如何最大限度地发挥信息工具的作用。《设计中的视觉思维》特点:呈现了视觉思维的复杂过程,这个复杂过程的每个阶段都需要特定的设计技术来支持。为设计人员和负责设计的软件开发人员提供了实用的、任务导向的信息。书中实例丰富,图文并茂。使用”主动视觉”的原则,将图形设计看作是一种认知工具。 -
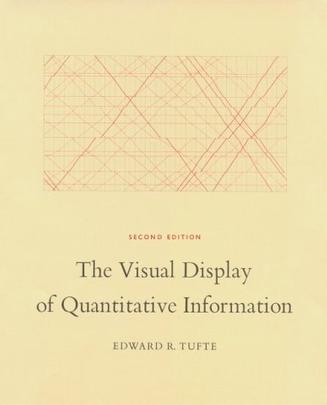
The Visual Display of Quantitative Information
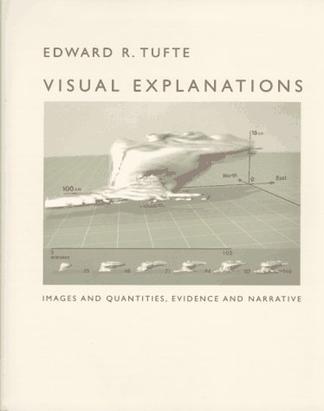
The classic book on statistical graphics, charts, tables. Theory and practice in the design of data graphics, 250 illustrations of the best (and a few of the worst) statistical graphics, with detailed analysis of how to display data for precise, effective, quick analysis. Design of the high-resolution displays, small multiples. Editing and improving graphics. The data-ink ratio. Time-series, relational graphics, data maps, multivariate designs. Detection of graphical deception: design variation vs. data variation. Sources of deception. Aesthetics and data graphical displays. This is the second edition of The Visual Display of Quantitative Information. Recently published, this new edition provides excellent color reproductions of the many graphics of William Playfair, adds color to other images, and includes all the changes and corrections accumulated during 17 printings of the first edition. This book celebrates escapes from the flatlands of both paper and computer screen, showing superb displays of high-dimensional complex data. The most design-oriented of Edward Tufte's books, Envisioning Information shows maps, charts, scientific presentations, diagrams, computer interfaces, statistical graphics and tables, stereo photographs, guidebooks, courtroom exhibits, timetables, use of color, a pop-up, and many other wonderful displays of information. The book provides practical advice about how to explain complex material by visual means, with extraordinary examples to illustrate the fundamental principles of information displays. Topics include escaping flatland, color and information, micro/macro designs, layering and separation, small multiples, and narratives. Winner of 17 awards for design and content. 400 illustrations with exquisite 6- to 12-color printing throughout. Highest quality design and production. Visual Explanations: Images and Quantities, Evidence and Narrative is about pictures of verbs, the representation of mechanism and motion, process and dynamics, causes and effects, explanation and narrative. Practical applications and examples include statistical graphics, charts for making important decisions in engineering and medicine, technical manuals, diagrams, design of computer interfaces and websites and on-line manuals, animations and scientific visualizations, techniques for talks, and design strategies for enhancing the rate of information transfer in print, presentations, and computer screens. The use of visual evidence in deciding to launch the space shuttle Challenger is discussed in careful detail. Video snapshots show redesigns of a supercomputer animation of a thunderstorm. The book is designed and printed to the highest standards, with luscious color throughout and four built-in flaps for showing motion and before/after effects. -
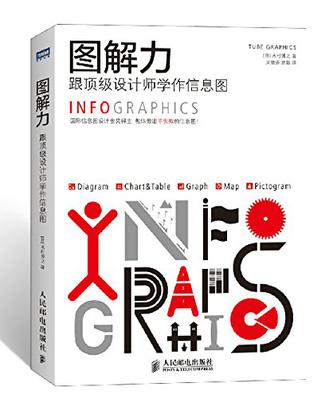
图解力
国际信息图设计金奖得主 教你做出不失败的信息图! ================================= 读图时代,你必须有这本! ◎72个章节,剖析图解一切信息的法则 ◎168幅图例,照葫芦画瓢,立马上手 ◎穿插国际设计大师的作品,榜样正能量 本书将信息图的呈现方式分为:图解(Diagram)、图表(Chart)、表格(Table)、统计图(Graph)、地图(Map)、图形符号(Pictogram) 。结合丰富的案例,分别介绍了信息图设计的72 个技巧和需要注意的问题。本书直观形象、通俗易懂,具有极强的实践 指导作用。 本书适合各行业进行信息呈现的设计人员阅读。 -
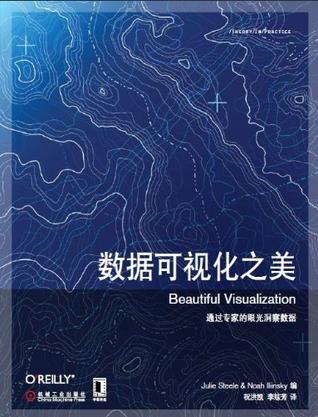
数据可视化之美
《数据可视化之美》内容简介:可视化是数据描述的图形表示,旨在一目了然地揭示数据中的复杂信息。可视化的典型如纽约地铁图和人脑图。成功的可视化的美丽之处既在于其艺术设计,也在于其通过对细节的优雅展示,能够有效地产生对数据的洞察和新的理解。 在《数据可视化之美》中,20多位可视化专家包括艺术家、设计师、评论家、科学家、分析师、统计学家等,展示了他们如何在各自的学科领域内开展项目。他们共同展示了可视化所能实现的功能以及如何使用它来改变世界。在《数据可视化之美》中,你将: 通过简单的可视化实践探索讲故事的重要性。 了解颜色如何传达我们尚未充分意识到而大脑已经识别出的信息。 发现我们购买的书籍和我们的交际圈如何揭示内心的自我。 通过对民航交通的可视化探索识别航空旅行的混乱的一种方法。 揭秘研究人员如何调查未知问题,包括从最初的草图到发表的论文。 点击链接进入o'reilly之美系列: 《代码之美》 《项目管理之美》 《架构之美》 《团队之美》 《测试之美》 《数据之美》 《安全之美》 《数据可视化之美》 -
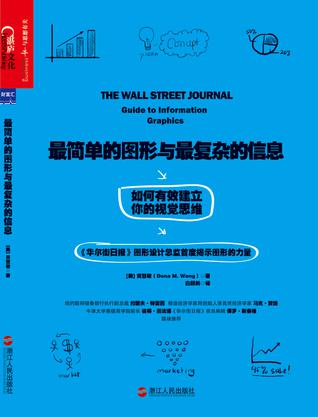
最简单的图形与最复杂的信息
[内容简介] ★在当今这个数据驱动、信息大爆炸的时代,我们需要懂得如何利用图形语言清晰、高效地表达自己。可是,我们应该如何选择反映信息的最佳图形?如何利用黑白两色令图形“多彩”?如何让“相貌平平”的图表升级为“才华出众”的图表?如何建立自己的视觉思维,以找到最有力的方式在最短的时间内打动决策者? ★在本书中,黄慧敏将数据分析和图形制作巧妙地结合在一起,清晰、有效地告诉我们如何将纷繁复杂的图形和陈述报告变得既简单又有表现力,实操性很强,且易于理解。 [编辑推荐] ★这是《华尔街日报》与作者第一次公开这种专业秘诀,出版后破天荒打进美国亚马逊金融投资类第一名、《纽约时报》商业类排行榜第九名。 ★作者是数据可视化权威爱德华•塔夫特(Edward Tufte)的学生,拥有耶鲁大学美术硕士学位,处理财金图表经验逾20年。 ★麦肯锡公司形象化沟通主管、纽约联邦储备银行执行副总裁、穆迪经济学家网创始人兼首席经济学家、牛津大学赛德商学院长、《华尔街日报》前总编辑等,对于黄慧敏非凡的资料解释能力、视觉呈现能力,都赞不绝口。 ★湛庐文化出品。
热门标签
下载排行榜
- 1 梦的解析:最佳译本
- 2 李鸿章全传
- 3 淡定的智慧
- 4 心理操控术
- 5 哈佛口才课
- 6 俗世奇人
- 7 日瓦戈医生
- 8 笑死你的逻辑学
- 9 历史老师没教过的历史
- 10 1分钟和陌生人成为朋友

