欢迎来到相识电子书!
标签:data
-
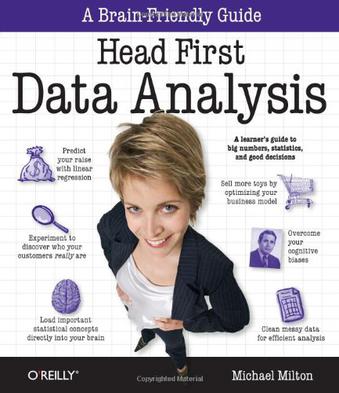
Head First Data Analysis
Today, interpreting data is a critical decision-making factor for businesses and organizations. If your job requires you to manage and analyze all kinds of data, turn to "Head First Data Analysis", where you'll quickly learn how to collect and organize data, sort the distractions from the truth, find meaningful patterns, draw conclusions, predict the future, and present your findings to others. Whether you're a product developer researching the market viability of a new product or service, a marketing manager gauging or predicting the effectiveness of a campaign, a salesperson who needs data to support product presentations, or a lone entrepreneur responsible for all of these data-intensive functions and more, the unique approach in "Head First Data Analysis" is by far the most efficient way to learn what you need to know to convert raw data into a vital business tool. You'll learn how to: determine which data sources to use for collecting information; assess data quality and distinguish signal from noise; build basic data models to illuminate patterns, and assimilate new information into the models; cope with ambiguous information; design experiments to test hypotheses and draw conclusions; use segmentation to organize your data within discrete market groups; visualize data distributions to reveal new relationships and persuade others; predict the future with sampling and probability models; clean your data to make it useful; and, communicate the results of your analysis to your audience. Using the latest research in cognitive science and learning theory to craft a multi-sensory learning experience, "Head First Data Analysis" uses a visually rich format designed for the way your brain works, not a text-heavy approach that puts you to sleep. -
Beautiful Data
In this insightful book, you'll learn from the best data practitioners in the field just how wide-ranging - and beautiful - working with data can be. Join 39 contributors as they explain how they developed simple and elegant solutions on projects ranging from the Mars lander to a Radiohead video. With "Beautiful Data", you will: explore the opportunities and challenges involved in working with the vast number of datasets made available by the Web; learn how to visualize trends in urban crime, using maps and data mashups; discover the challenges of designing a data processing system that works within the constraints of space travel; also learn how crowdsourcing and transparency have combined to advance the state of drug research; and, understand how new data can automatically trigger alerts when it matches or overlaps pre-existing data. Learn about the massive infrastructure required to create, capture, and process DNA data. That's only small sample of what you'll find in "Beautiful Data". For anyone who handles data, this is a truly fascinating book. Contributors include: Nathan Yau; Jonathan Follett and Matt Holm; J.M. Hughes; Raghu Ramakrishnan, Brian Cooper, and Utkarsh Srivastava; Jeff Hammerbacher; Jason Dykes and Jo Wood; Jeff Jonas and Lisa Sokol; Jud Valeski; Alon Halevy and Jayant Madhavan; Aaron Koblin and Valdean Klump; Michal Migurski; Jeff Heer; Coco Krumme; Peter Norvig; Matt Wood and Ben Blackburne; Jean-Claude Bradley, Rajarshi Guha, Andrew Lang, Pierre Lindenbaum, Cameron Neylon, Antony Williams, and Egon Willighagen; Lukas Biewald and Brendan O'Connor; Hadley Wickham, Deborah Swayne, and David Poole; Andrew Gelman, Jonathan P. Kastellec, and Yair Ghitza; and, Toby Segaran. -
Visualizing Data
Enormous quantities of data go unused or underused today, simply because people can't visualize the quantities and relationships in it. Using a downloadable programming environment developed by the author, Visualizing Data demonstrates methods for representing data accurately on the Web and elsewhere, complete with user interaction, animation, and more. How do the 3.1 billion A, C, G and T letters of the human genome compare to those of a chimp or a mouse? What do the paths that millions of visitors take through a web site look like? With Visualizing Data, you learn how to answer complex questions like these with thoroughly interactive displays. We're not talking about cookie-cutter charts and graphs. This book teaches you how to design entire interfaces around large, complex data sets with the help of a powerful new design and prototyping tool called "Processing". Used by many researchers and companies to convey specific data in a clear and understandable manner, the Processing beta is available free. With this tool and Visualizing Data as a guide, you'll learn basic visualization principles, how to choose the right kind of display for your purposes, and how to provide interactive features that will bring users to your site over and over. This book teaches you: * The seven stages of visualizing data -- acquire, parse, filter, mine, represent, refine, and interact * How all data problems begin with a question and end with a narrative construct that provides a clear answer without extraneous details * Several example projects with the code to make them work * Positive and negative points of each representation discussed. The focus is on customization so that each one best suits what you want to convey about your data set The book does not provide ready-made "visualizations" that can be plugged into any data set. Instead, with chapters divided by types of data rather than types of display, you'll learn how each visualization conveys the unique properties of the data it represents -- why the data was collected, what's interesting about it, and what stories it can tell. Visualizing Data teaches you how to answer questions, not simply display information.
热门标签
下载排行榜
- 1 梦的解析:最佳译本
- 2 李鸿章全传
- 3 淡定的智慧
- 4 心理操控术
- 5 哈佛口才课
- 6 俗世奇人
- 7 日瓦戈医生
- 8 笑死你的逻辑学
- 9 历史老师没教过的历史
- 10 1分钟和陌生人成为朋友


